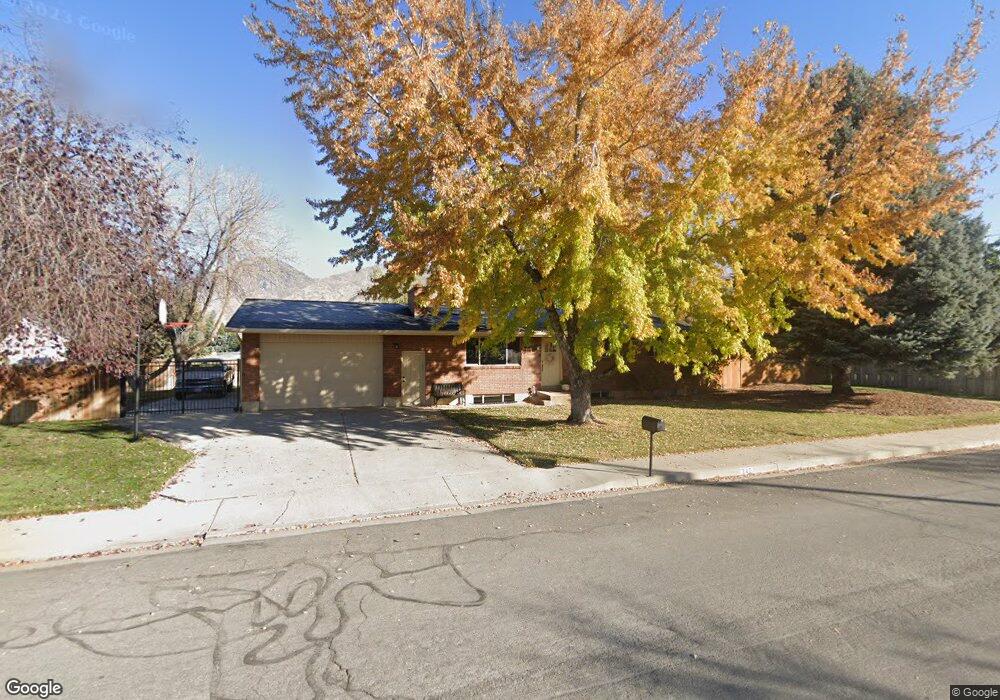
247 E 200 N Mapleton, UT 84664
Estimated Value: $536,000 - $636,000
5
Beds
2
Baths
2,200
Sq Ft
$256/Sq Ft
Est. Value
About This Home
This home is located at 247 E 200 N, Mapleton, UT 84664 and is currently estimated at $563,971, approximately $256 per square foot. 247 E 200 N is a home located in Utah County with nearby schools including Mapleton School, Mapleton Junior High School, and Maple Mountain High School.
Ownership History
Date
Name
Owned For
Owner Type
Purchase Details
Closed on
Apr 30, 2007
Sold by
Ellis Jacob Kelly and Ellis Cynthia Rae
Bought by
Nelson Robert L and Nelson Lynette
Current Estimated Value
Home Financials for this Owner
Home Financials are based on the most recent Mortgage that was taken out on this home.
Original Mortgage
$145,800
Outstanding Balance
$88,540
Interest Rate
6.14%
Mortgage Type
Purchase Money Mortgage
Estimated Equity
$475,431
Purchase Details
Closed on
Feb 1, 2007
Sold by
Ellis Kelly and Ellis Becky
Bought by
Ellis Jacob Kelly and Ellis Cynthia Rae
Purchase Details
Closed on
Jun 5, 2000
Sold by
Vincent R Scott R and Vincent Florence M
Bought by
Ellis Kelly and Ellis Becky
Purchase Details
Closed on
Jan 29, 1998
Sold by
Sherman Mildred
Bought by
Vincent R Scott R and Vincent Florence M
Home Financials for this Owner
Home Financials are based on the most recent Mortgage that was taken out on this home.
Original Mortgage
$108,000
Interest Rate
7.05%
Create a Home Valuation Report for This Property
The Home Valuation Report is an in-depth analysis detailing your home's value as well as a comparison with similar homes in the area
Home Values in the Area
Average Home Value in this Area
Purchase History
| Date | Buyer | Sale Price | Title Company |
|---|---|---|---|
| Nelson Robert L | -- | Inwest Title Services Inc | |
| Ellis Jacob Kelly | -- | Old Republic Title Company | |
| Ellis Kelly | -- | Empire Land Title Company | |
| Vincent R Scott R | -- | -- |
Source: Public Records
Mortgage History
| Date | Status | Borrower | Loan Amount |
|---|---|---|---|
| Open | Nelson Robert L | $145,800 | |
| Previous Owner | Vincent R Scott R | $108,000 |
Source: Public Records
Tax History
| Year | Tax Paid | Tax Assessment Tax Assessment Total Assessment is a certain percentage of the fair market value that is determined by local assessors to be the total taxable value of land and additions on the property. | Land | Improvement |
|---|---|---|---|---|
| 2025 | $2,452 | $269,280 | -- | -- |
| 2024 | $2,452 | $240,240 | $0 | $0 |
| 2023 | $2,468 | $243,265 | $0 | $0 |
| 2022 | $2,725 | $265,595 | $0 | $0 |
| 2021 | $2,252 | $337,100 | $149,000 | $188,100 |
| 2020 | $2,211 | $320,000 | $131,900 | $188,100 |
| 2019 | $2,015 | $297,700 | $126,500 | $171,200 |
| 2018 | $1,808 | $254,300 | $106,600 | $147,700 |
| 2017 | $1,732 | $129,305 | $0 | $0 |
| 2016 | $1,693 | $125,620 | $0 | $0 |
| 2015 | $1,629 | $120,175 | $0 | $0 |
| 2014 | $1,500 | $108,625 | $0 | $0 |
Source: Public Records
Map
Nearby Homes
Your Personal Tour Guide
Ask me questions while you tour the home.