Estimated Value: $183,000 - $230,000
3
Beds
1
Bath
2,288
Sq Ft
$93/Sq Ft
Est. Value
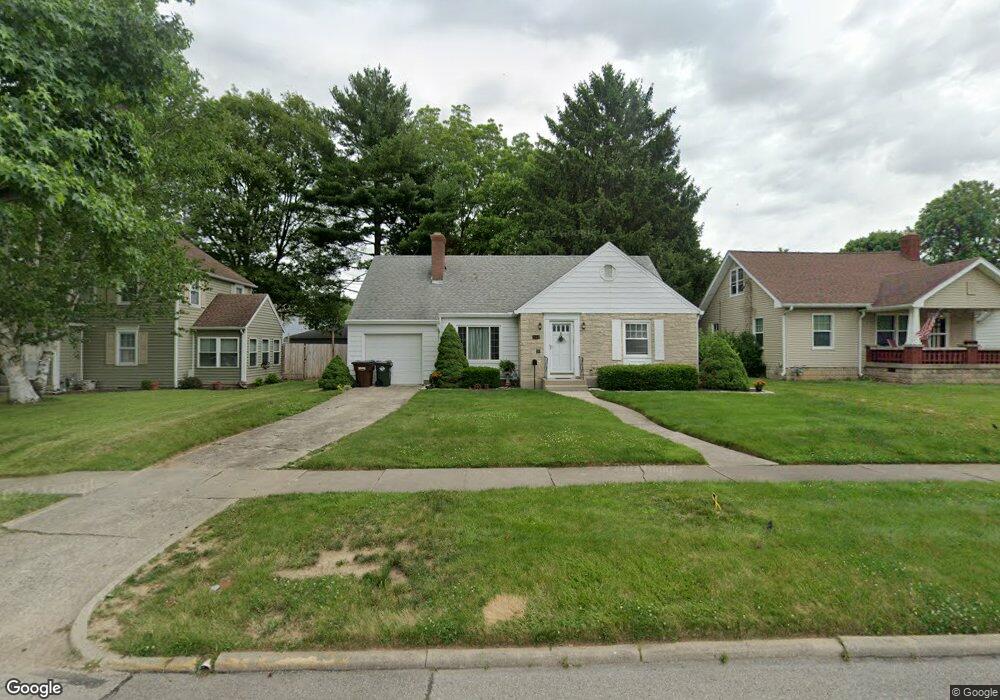
About This Home
This home is located at 247 Edison Blvd, Xenia, OH 45385 and is currently estimated at $212,494, approximately $92 per square foot. 247 Edison Blvd is a home located in Greene County with nearby schools including Xenia High School, Summit Academy Community School for Alternative Learners - Xenia, and Legacy Christian Academy.
Ownership History
Date
Name
Owned For
Owner Type
Purchase Details
Closed on
Apr 30, 2019
Sold by
Peterson David S and Graham Betty L S
Bought by
Ludington Penny
Current Estimated Value
Purchase Details
Closed on
Apr 30, 1999
Sold by
Powers Scott M and Powers Amy
Bought by
Graham Elmer R and Graham Betty L S
Purchase Details
Closed on
Mar 24, 1999
Sold by
Lansell Suellen C and Lansell Robert P
Bought by
Powers Scott M
Purchase Details
Closed on
Mar 15, 1999
Sold by
Grether Rebecca Jane and Grether Donald F
Bought by
Powers Scott M
Purchase Details
Closed on
May 16, 1996
Sold by
Bales Eleanor L
Bought by
Powers Scott M
Home Financials for this Owner
Home Financials are based on the most recent Mortgage that was taken out on this home.
Original Mortgage
$76,500
Interest Rate
7.86%
Mortgage Type
Balloon
Create a Home Valuation Report for This Property
The Home Valuation Report is an in-depth analysis detailing your home's value as well as a comparison with similar homes in the area
Home Values in the Area
Average Home Value in this Area
Purchase History
| Date | Buyer | Sale Price | Title Company |
|---|---|---|---|
| Ludington Penny | $110,000 | None Available | |
| Graham Elmer R | $100,000 | -- | |
| Powers Scott M | -- | -- | |
| Powers Scott M | -- | -- | |
| Powers Scott M | $85,000 | -- |
Source: Public Records
Mortgage History
| Date | Status | Borrower | Loan Amount |
|---|---|---|---|
| Previous Owner | Powers Scott M | $76,500 |
Source: Public Records
Tax History Compared to Growth
Tax History
| Year | Tax Paid | Tax Assessment Tax Assessment Total Assessment is a certain percentage of the fair market value that is determined by local assessors to be the total taxable value of land and additions on the property. | Land | Improvement |
|---|---|---|---|---|
| 2024 | $2,035 | $58,600 | $8,740 | $49,860 |
| 2023 | $2,035 | $58,600 | $8,740 | $49,860 |
| 2022 | $1,677 | $43,040 | $5,460 | $37,580 |
| 2021 | $2,133 | $43,040 | $5,460 | $37,580 |
| 2020 | $2,042 | $43,040 | $5,460 | $37,580 |
| 2019 | $1,610 | $40,700 | $5,680 | $35,020 |
| 2018 | $1,616 | $40,700 | $5,680 | $35,020 |
| 2017 | $1,569 | $40,700 | $5,680 | $35,020 |
| 2016 | $1,401 | $35,940 | $5,680 | $30,260 |
| 2015 | $2,544 | $35,940 | $5,680 | $30,260 |
| 2014 | $1,070 | $35,940 | $5,680 | $30,260 |
Source: Public Records
Map
Nearby Homes
- 261 Edison Blvd
- 235 Edison Blvd
- 221 Garfield Ave
- 222 Hayes Ave
- 273 Edison Blvd
- 225 Edison Blvd
- 231 Garfield Ave
- 244 Edison Blvd
- 252 Edison Blvd
- 262 Edison Blvd
- 236 Edison Blvd
- 248 N Monroe Dr
- 258 N Monroe Dr
- 224 Edison Blvd
- 251 Garfield Ave
- 229 Hayes Ave
- 214 Edison Blvd
- 254 Hayes Ave
- 292 Edison Blvd
- 150 Sheridan Ave