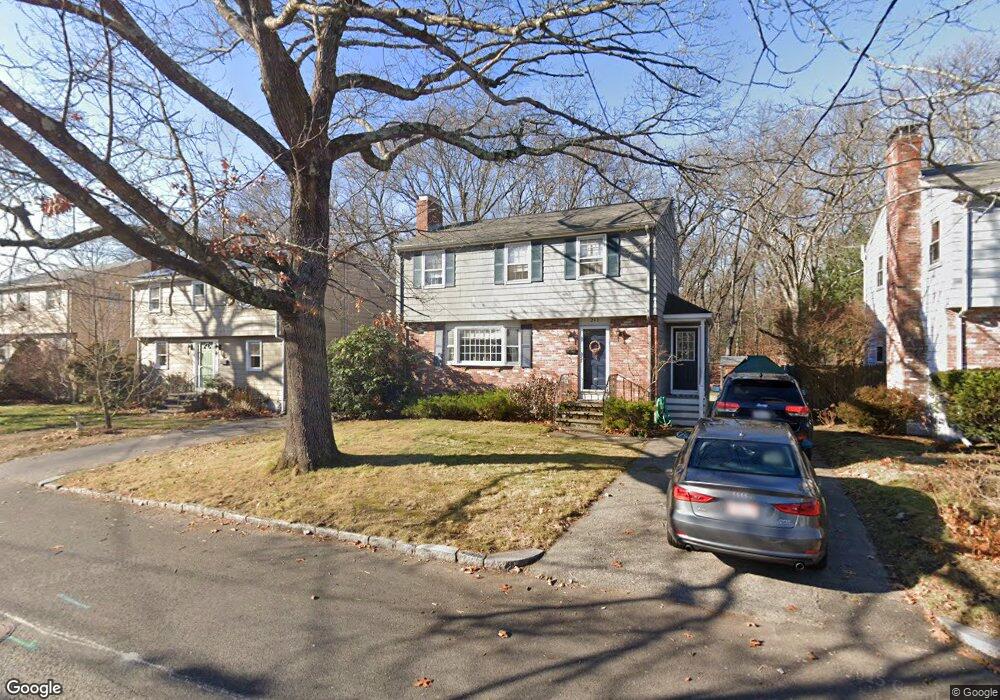
247 Sylvia St Arlington, MA 02476
Arlington Heights NeighborhoodEstimated Value: $935,000 - $1,224,000
3
Beds
3
Baths
1,708
Sq Ft
$623/Sq Ft
Est. Value
About This Home
This home is located at 247 Sylvia St, Arlington, MA 02476 and is currently estimated at $1,063,447, approximately $622 per square foot. 247 Sylvia St is a home located in Middlesex County with nearby schools including Dallin Elementary School, Ottoson Middle School, and Arlington High School.
Ownership History
Date
Name
Owned For
Owner Type
Purchase Details
Closed on
Nov 13, 2024
Sold by
Haig Stephen H and Haig Jean H
Bought by
Stephen H Haig 2024 Ft and Haig
Current Estimated Value
Purchase Details
Closed on
May 1, 1985
Bought by
Haig Stephen H and Haig Jean H
Create a Home Valuation Report for This Property
The Home Valuation Report is an in-depth analysis detailing your home's value as well as a comparison with similar homes in the area
Home Values in the Area
Average Home Value in this Area
Purchase History
| Date | Buyer | Sale Price | Title Company |
|---|---|---|---|
| Stephen H Haig 2024 Ft | -- | None Available | |
| Stephen H Haig 2024 Ft | -- | None Available | |
| Haig Stephen H | $160,000 | -- |
Source: Public Records
Mortgage History
| Date | Status | Borrower | Loan Amount |
|---|---|---|---|
| Previous Owner | Haig Stephen H | $25,851 | |
| Previous Owner | Haig Stephen H | $110,300 |
Source: Public Records
Tax History
| Year | Tax Paid | Tax Assessment Tax Assessment Total Assessment is a certain percentage of the fair market value that is determined by local assessors to be the total taxable value of land and additions on the property. | Land | Improvement |
|---|---|---|---|---|
| 2025 | $8,866 | $823,200 | $444,000 | $379,200 |
| 2024 | $8,286 | $782,400 | $427,300 | $355,100 |
| 2023 | $8,117 | $724,100 | $399,600 | $324,500 |
| 2022 | $7,917 | $693,300 | $388,500 | $304,800 |
| 2021 | $7,769 | $685,100 | $388,500 | $296,600 |
| 2020 | $7,325 | $662,300 | $388,500 | $273,800 |
| 2019 | $6,865 | $609,700 | $383,000 | $226,700 |
| 2018 | $6,242 | $514,600 | $294,100 | $220,500 |
| 2017 | $6,255 | $498,000 | $277,500 | $220,500 |
| 2016 | $6,090 | $475,800 | $255,300 | $220,500 |
| 2015 | $6,180 | $456,100 | $238,700 | $217,400 |
Source: Public Records
Map
Nearby Homes
- 64 Browning Rd
- 4 Aerial St
- 122 Sylvia St
- 211 Florence Ave
- 36 Dundee Rd
- 74 Wollaston Ave
- 12 Brandon St
- 34 Bow St
- 31 Greensbrook Way
- 120 Crestview Rd
- 15 Bird Hill Rd
- 53 Crestview Rd
- 164 Hillside Ave
- 181 Lowell St
- 135 Marsh St
- 7 Park Avenue Extension
- 97 Bow St
- 45 Webster Rd
- 33 Harvard St
- 17 Oakledge St
Your Personal Tour Guide
Ask me questions while you tour the home.