Estimated Value: $293,000 - $339,058
3
Beds
2
Baths
1,547
Sq Ft
$202/Sq Ft
Est. Value
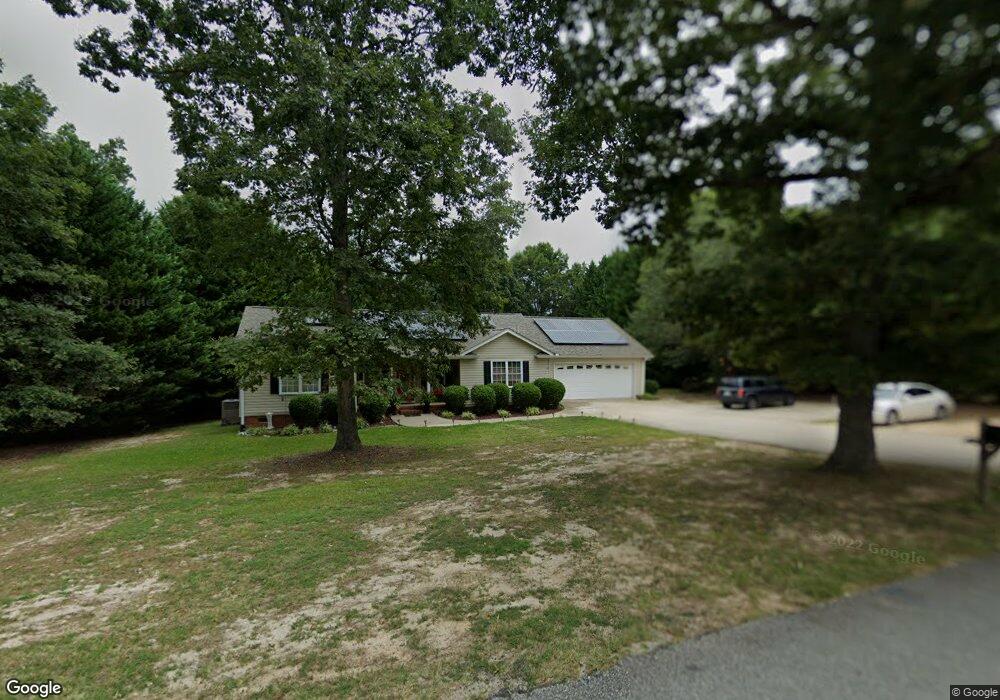
About This Home
This home is located at 247 Tapp Cir, Lyman, SC 29365 and is currently estimated at $312,015, approximately $201 per square foot. 247 Tapp Cir is a home located in Spartanburg County with nearby schools including Lyman Elementary School, D.R. Hill Middle School, and Byrnes Freshman Academy.
Ownership History
Date
Name
Owned For
Owner Type
Purchase Details
Closed on
Jun 3, 2024
Sold by
Bissonnette Seth A
Bought by
Noonan Kenneth Mitchell and Hawkins Stephanie J
Current Estimated Value
Home Financials for this Owner
Home Financials are based on the most recent Mortgage that was taken out on this home.
Original Mortgage
$301,342
Outstanding Balance
$297,555
Interest Rate
7.1%
Mortgage Type
New Conventional
Estimated Equity
$14,460
Purchase Details
Closed on
Mar 30, 2007
Sold by
Browder John M
Bought by
Bissonnette Seth A
Home Financials for this Owner
Home Financials are based on the most recent Mortgage that was taken out on this home.
Original Mortgage
$130,000
Interest Rate
6.15%
Mortgage Type
Unknown
Purchase Details
Closed on
Oct 19, 2001
Sold by
Martens Johann M and Martens Elaine B
Bought by
Browder John M
Create a Home Valuation Report for This Property
The Home Valuation Report is an in-depth analysis detailing your home's value as well as a comparison with similar homes in the area
Home Values in the Area
Average Home Value in this Area
Purchase History
| Date | Buyer | Sale Price | Title Company |
|---|---|---|---|
| Noonan Kenneth Mitchell | $295,000 | None Listed On Document | |
| Bissonnette Seth A | $130,000 | None Available | |
| Browder John M | $124,900 | -- |
Source: Public Records
Mortgage History
| Date | Status | Borrower | Loan Amount |
|---|---|---|---|
| Open | Noonan Kenneth Mitchell | $301,342 | |
| Previous Owner | Bissonnette Seth A | $130,000 |
Source: Public Records
Tax History
| Year | Tax Paid | Tax Assessment Tax Assessment Total Assessment is a certain percentage of the fair market value that is determined by local assessors to be the total taxable value of land and additions on the property. | Land | Improvement |
|---|---|---|---|---|
| 2025 | $1,063 | $11,800 | $536 | $11,264 |
| 2024 | $1,063 | $6,840 | $344 | $6,496 |
| 2023 | $1,063 | $6,840 | $344 | $6,496 |
Source: Public Records
Map
Nearby Homes
- 225 Josh Ct
- 115 Lake Lyman Heights
- 0 Jordan Rd Unit SPN331464
- 0 Jordan Rd Unit 1576355
- 230 Lake Lyman Heights
- 518 Life Ln
- 542 Life Ln
- 311 Ponder Rd
- 313 Ponder Rd
- 00 Lake Vista Dr
- 128 Becky Gibson Rd
- 27 Shasta Dr
- 0 Lyman Lodge Rd
- 3505 Ballenger Rd
- 204 Ridge Climb Trail
- 51 Oak Edge Ln
- 83 Oak Edge Ln
- 611 W Star Dr
- 656 Clairbook Ct
- 525 Sapling Gap Rd
- 229 Tapp Cir
- 257 Tapp Cir
- 217 Tapp Cir Unit 213, 217 & 219 Tapp
- 459 Becky Gibson Rd
- 437 Becky Gibson Rd
- 433 Becky Gibson Rd
- 949 Jordan Rd
- 940 Jordan Rd
- 460 Becky Gibson Rd
- 194 Henson Dr
- 101 Tapp Cir
- 1030 Jordan Rd
- 960 Jordan Rd
- 1049 Jordan Rd
- 1057 Jordan Rd
- 180 Henson Dr
- 191 Henson Dr
- 1047 Jordan Rd
- 1040 Jordan Rd
- 1077 Jordan Rd
Your Personal Tour Guide
Ask me questions while you tour the home.