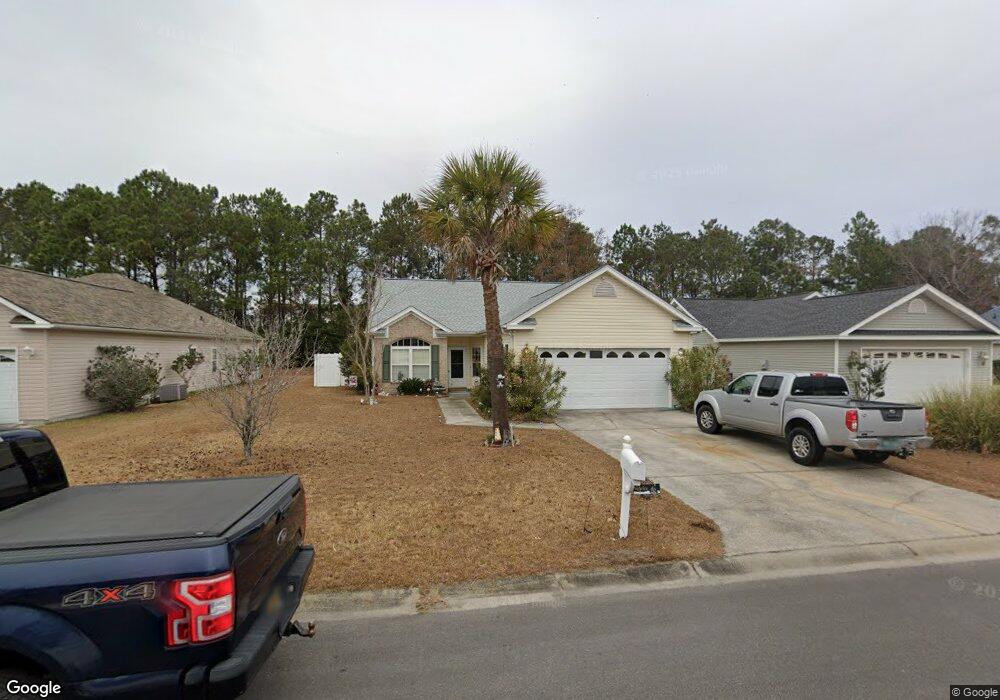
247 Tibton Cir Myrtle Beach, SC 29588
Estimated Value: $272,927 - $300,000
3
Beds
2
Baths
1,423
Sq Ft
$201/Sq Ft
Est. Value
About This Home
This home is located at 247 Tibton Cir, Myrtle Beach, SC 29588 and is currently estimated at $286,732, approximately $201 per square foot. 247 Tibton Cir is a home located in Horry County with nearby schools including Lakewood Elementary, Socastee Middle, and Socastee High School.
Ownership History
Date
Name
Owned For
Owner Type
Purchase Details
Closed on
Nov 17, 2005
Sold by
Clayton William A and Clayton Shirley M
Bought by
Fitzgerald Paul A and Fitzgerald Lynette S
Current Estimated Value
Home Financials for this Owner
Home Financials are based on the most recent Mortgage that was taken out on this home.
Original Mortgage
$116,800
Outstanding Balance
$63,997
Interest Rate
6.04%
Mortgage Type
Fannie Mae Freddie Mac
Estimated Equity
$222,735
Purchase Details
Closed on
Aug 10, 2000
Sold by
Harmon Betty
Bought by
Clayton William A and Clayton Shirley M
Home Financials for this Owner
Home Financials are based on the most recent Mortgage that was taken out on this home.
Original Mortgage
$96,000
Interest Rate
8.07%
Mortgage Type
Purchase Money Mortgage
Purchase Details
Closed on
Apr 10, 2000
Sold by
Richco Realty & Construction Company Inc
Bought by
Harmon Betty
Purchase Details
Closed on
Dec 15, 1999
Sold by
Palmetto Glen Llc
Bought by
Richco Realty & Construction Co Inc
Create a Home Valuation Report for This Property
The Home Valuation Report is an in-depth analysis detailing your home's value as well as a comparison with similar homes in the area
Home Values in the Area
Average Home Value in this Area
Purchase History
| Date | Buyer | Sale Price | Title Company |
|---|---|---|---|
| Fitzgerald Paul A | $146,000 | -- | |
| Clayton William A | $124,900 | -- | |
| Harmon Betty | $119,900 | -- | |
| Richco Realty & Construction Co Inc | $26,900 | -- |
Source: Public Records
Mortgage History
| Date | Status | Borrower | Loan Amount |
|---|---|---|---|
| Open | Fitzgerald Paul A | $116,800 | |
| Previous Owner | Clayton William A | $96,000 |
Source: Public Records
Tax History Compared to Growth
Tax History
| Year | Tax Paid | Tax Assessment Tax Assessment Total Assessment is a certain percentage of the fair market value that is determined by local assessors to be the total taxable value of land and additions on the property. | Land | Improvement |
|---|---|---|---|---|
| 2024 | $2,274 | $14,774 | $4,546 | $10,228 |
| 2023 | $2,274 | $9,454 | $2,238 | $7,216 |
| 2021 | $2,099 | $10,182 | $2,238 | $7,944 |
| 2020 | $1,983 | $10,182 | $2,238 | $7,944 |
| 2019 | $1,983 | $10,182 | $2,238 | $7,944 |
| 2018 | $1,793 | $8,221 | $1,969 | $6,252 |
| 2017 | $1,778 | $8,221 | $1,969 | $6,252 |
| 2016 | -- | $8,221 | $1,969 | $6,252 |
| 2015 | $1,793 | $8,221 | $1,969 | $6,252 |
| 2014 | $1,733 | $8,221 | $1,969 | $6,252 |
Source: Public Records
Map
Nearby Homes
- Parcel "A" Palmetto Pointe Blvd
- 4008 Braid Ct
- 424 Wallingford Cir
- 609 Glen Haven Dr
- 109 Old Town Way Unit 4
- 215 Tibton Cir
- 489 Wallingford Cir
- 486 Wallingford Cir
- 121 Olde Towne Way Unit 2
- 313 Harbour Reef Dr
- 140 Olde Towne Way Unit 2
- 140 Olde Towne Way Unit 1
- 507 Slaty Dr
- 532 Calypso Dr
- 523 Slaty Dr
- 220 Rice Mill Dr
- 632 Kindred Dr
- 157 Olde Towne Way Unit 4
- 558 Slaty Dr
- 3088 Rockwater Cir
- 245 Tibton Cir
- 249 Tibton Cir
- 243 Tibton Cir
- 251 Tibton Cir
- 244 Tibton Cir
- 253 Tibton Cir
- Parcel A Palmetto Pointe Blvd
- 241 Tibton Cir
- 242 Tibton Cir
- 250 Tibton Cir
- 252 Tibton Cir
- 240 Tibton Cir
- 240 Tibton Cir Unit Palmetto Glen
- 302 Sherrybrook Dr
- 254 Tibton Cir
- 239 Tibton Cir
- 105 Palmetto Glen Dr
- 259 Tibton Cir Unit MB
- 304 Sherrybrook Dr
- 305 Sherrybrook Dr