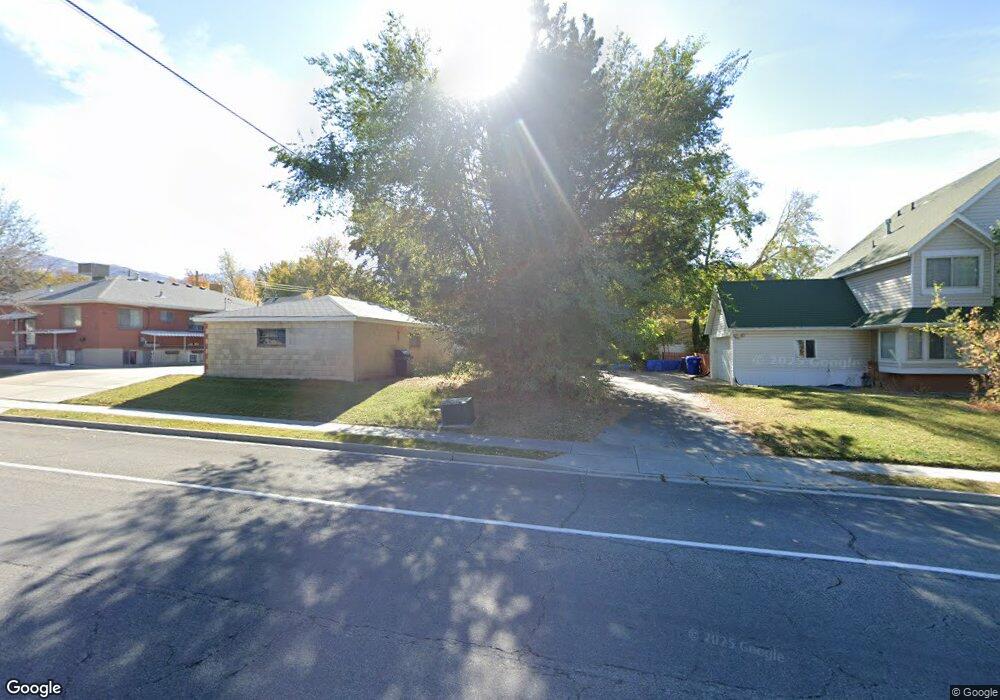
247 W 1800 S Bountiful, UT 84010
Estimated Value: $598,820 - $655,000
4
Beds
4
Baths
2,177
Sq Ft
$290/Sq Ft
Est. Value
About This Home
This home is located at 247 W 1800 S, Bountiful, UT 84010 and is currently estimated at $631,705, approximately $290 per square foot. 247 W 1800 S is a home located in Davis County with nearby schools including Bountiful Elementary School, Mueller Park Junior High School, and Woods Cross High School.
Ownership History
Date
Name
Owned For
Owner Type
Purchase Details
Closed on
Oct 11, 2024
Sold by
Horsley Verona Elizabeth
Bought by
Horsley Roy
Current Estimated Value
Home Financials for this Owner
Home Financials are based on the most recent Mortgage that was taken out on this home.
Original Mortgage
$200,000
Outstanding Balance
$164,358
Interest Rate
6.35%
Mortgage Type
New Conventional
Estimated Equity
$467,347
Purchase Details
Closed on
Feb 17, 2009
Sold by
Gibson Robert P and Gibson Meredith A
Bought by
Horsley Roy and Horsley Verona Elizabeth
Home Financials for this Owner
Home Financials are based on the most recent Mortgage that was taken out on this home.
Original Mortgage
$254,308
Interest Rate
4.92%
Mortgage Type
FHA
Purchase Details
Closed on
Nov 12, 2002
Sold by
Carlson Robert and Carlson Karma Rae
Bought by
Gibson Robert P and Gibson Meridith A
Purchase Details
Closed on
Mar 3, 2000
Sold by
Gibson Robert P and Gibson Meredith A
Bought by
Gibson Robert P and Gibson Meredith A
Create a Home Valuation Report for This Property
The Home Valuation Report is an in-depth analysis detailing your home's value as well as a comparison with similar homes in the area
Purchase History
| Date | Buyer | Sale Price | Title Company |
|---|---|---|---|
| Horsley Roy | -- | Meridian Title | |
| Horsley Roy | -- | Mountain View Title | |
| Gibson Robert P | -- | -- | |
| Gibson Robert P | -- | -- |
Source: Public Records
Mortgage History
| Date | Status | Borrower | Loan Amount |
|---|---|---|---|
| Open | Horsley Roy | $200,000 | |
| Previous Owner | Horsley Roy | $254,308 |
Source: Public Records
Tax History
| Year | Tax Paid | Tax Assessment Tax Assessment Total Assessment is a certain percentage of the fair market value that is determined by local assessors to be the total taxable value of land and additions on the property. | Land | Improvement |
|---|---|---|---|---|
| 2025 | $3,614 | $300,850 | $99,713 | $201,137 |
| 2024 | $3,105 | $296,450 | $86,336 | $210,114 |
| 2023 | $2,948 | $510,000 | $200,887 | $309,113 |
| 2022 | $2,920 | $276,650 | $110,330 | $166,320 |
| 2021 | $2,757 | $378,000 | $144,291 | $233,709 |
| 2020 | $2,294 | $333,000 | $124,015 | $208,985 |
| 2019 | $2,366 | $336,000 | $136,245 | $199,755 |
| 2018 | $2,083 | $290,000 | $131,142 | $158,858 |
| 2016 | $1,722 | $129,360 | $53,886 | $75,474 |
| 2015 | $1,713 | $121,660 | $53,886 | $67,774 |
| 2014 | $1,574 | $114,396 | $53,886 | $60,510 |
| 2013 | -- | $131,189 | $35,598 | $95,591 |
Source: Public Records
Map
Nearby Homes
- 1950 S 200 W Unit 32
- 53 W 1800 S
- 2095 S Main St Unit 13
- 1820 S 50 W
- 33 W Wicker Ln
- 1314 S 200 W Unit 19
- 1350 S 200 W
- 304 W 2300 S
- 2064 S Orchard Dr
- 141 E 1650 S
- 188 E 2050 S Unit D3
- 1016 S 400 W
- 288 E 1650 S
- 109 W 900 S
- 291 E 1950 S
- 19 E North Canyon Rd
- 1619 S 700 W
- 1601 S 700 W
- 990 S 500 W
- 2008 S 700 W
- 1856 S 200 W
- 1824 S 200 W
- 1846 S 200 W
- 1842 S 200 W
- 1792 S 200 W
- 1880 S 200 W
- 1795 S Main St
- 1940 S 200 W
- 1940 S 200 W Unit 102
- 1940 S 200 W Unit 107
- 1940 S 200 W Unit 106
- 1940 S 200 W Unit 12
- 1940 S 200 W Unit 18
- 1940 S 200 W Unit 14
- 1940 S 200 W Unit 8
- 1940 S 200 W Unit 5
- 1940 S 200 W Unit 3
- 1940 S 200 W Unit 3
- 1940 S 200 W Unit 17
- 1940 S 200 W Unit 19
Your Personal Tour Guide
Ask me questions while you tour the home.