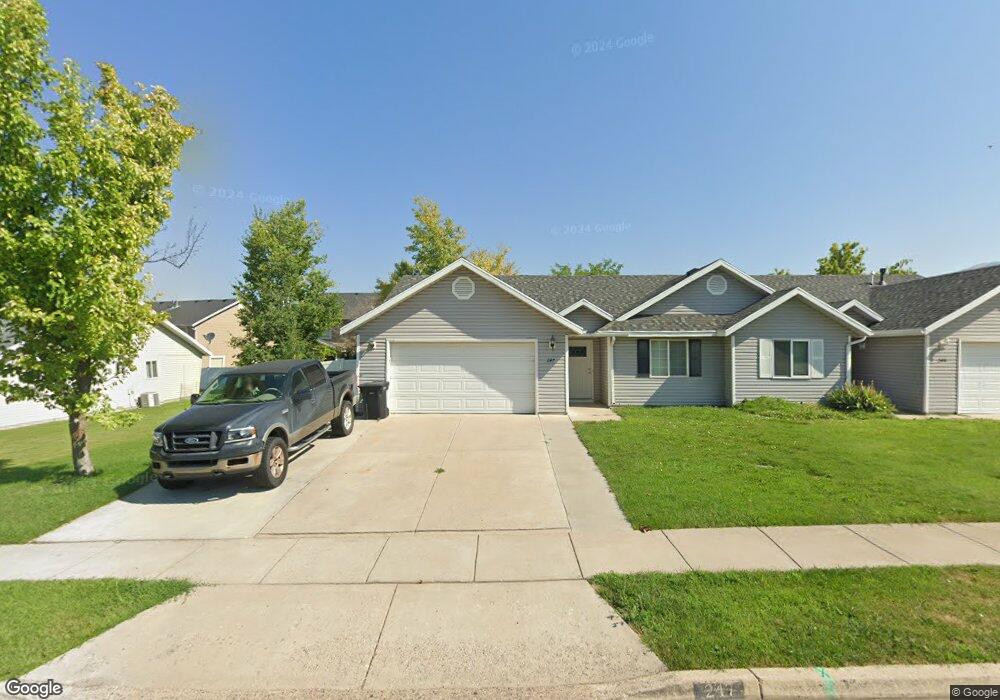
247 W 200 N Providence, UT 84332
Estimated Value: $318,000 - $402,577
3
Beds
2
Baths
1,252
Sq Ft
$284/Sq Ft
Est. Value
About This Home
This home is located at 247 W 200 N, Providence, UT 84332 and is currently estimated at $355,394, approximately $283 per square foot. 247 W 200 N is a home located in Cache County with nearby schools including River Heights School, Spring Creek Middle School, and South Cache Middle School.
Ownership History
Date
Name
Owned For
Owner Type
Purchase Details
Closed on
Sep 10, 2018
Sold by
Peterson Kirk K
Bought by
Brown Robert and Brown Chelsie
Current Estimated Value
Purchase Details
Closed on
Aug 9, 2010
Sold by
Fuit Janette and Sprague Melinda
Bought by
Peterson Kirk K
Purchase Details
Closed on
Sep 13, 2005
Sold by
Autry Joann R
Bought by
Autry Joann and Joann Autry Revocable Trust
Home Financials for this Owner
Home Financials are based on the most recent Mortgage that was taken out on this home.
Original Mortgage
$40,500
Interest Rate
5.7%
Mortgage Type
New Conventional
Purchase Details
Closed on
Sep 8, 2005
Sold by
Burton Victoria A
Bought by
Autry Joann R
Home Financials for this Owner
Home Financials are based on the most recent Mortgage that was taken out on this home.
Original Mortgage
$40,500
Interest Rate
5.7%
Mortgage Type
New Conventional
Create a Home Valuation Report for This Property
The Home Valuation Report is an in-depth analysis detailing your home's value as well as a comparison with similar homes in the area
Home Values in the Area
Average Home Value in this Area
Purchase History
| Date | Buyer | Sale Price | Title Company |
|---|---|---|---|
| Brown Robert | -- | Cache Title Logan | |
| Peterson Kirk K | -- | Hickman Land Title Company | |
| Peterson Kirk K | -- | Hickman Land Title Company | |
| Autry Joann | -- | Heritage West Title | |
| Autry Joann R | -- | Heritage West Title |
Source: Public Records
Mortgage History
| Date | Status | Borrower | Loan Amount |
|---|---|---|---|
| Previous Owner | Autry Joann R | $40,500 |
Source: Public Records
Tax History Compared to Growth
Tax History
| Year | Tax Paid | Tax Assessment Tax Assessment Total Assessment is a certain percentage of the fair market value that is determined by local assessors to be the total taxable value of land and additions on the property. | Land | Improvement |
|---|---|---|---|---|
| 2025 | $1,429 | $364,179 | $148,700 | $215,479 |
| 2024 | $1,554 | $368,471 | $148,700 | $219,771 |
| 2023 | $1,625 | $363,181 | $110,000 | $253,181 |
| 2022 | $1,389 | $293,181 | $40,000 | $253,181 |
| 2021 | $1,364 | $242,545 | $40,000 | $202,545 |
| 2020 | $1,101 | $181,554 | $40,000 | $141,554 |
| 2019 | $1,163 | $181,553 | $40,000 | $141,553 |
| 2018 | $1,023 | $163,090 | $40,000 | $123,090 |
| 2017 | $925 | $78,045 | $0 | $0 |
| 2016 | $935 | $78,045 | $0 | $0 |
| 2015 | $840 | $69,905 | $0 | $0 |
| 2014 | $819 | $69,905 | $0 | $0 |
| 2013 | -- | $69,905 | $0 | $0 |
Source: Public Records
Map
Nearby Homes
- 223 W 150 N
- 374 N 100 W
- 315 Mountain View Ln
- 410 Cobblestone
- 821 S 525 E
- 11 Mountain View Ln
- 201 E 580 N
- 476 Cobblestone
- 426 W 15 S
- 66 E Springs Ln
- 27 W Spring Creek Pkwy
- 76 E Springs Ln
- 427 W 65 S
- 462 W 40 S Unit 202
- 460 W 15 S Unit G202
- 470 W 15 S Unit F301
- 460 W 15 S Unit G201
- 460 W 15 S Unit G301
- 289 N 100 E
- 216 E 610 N
- 245 W 200 N
- 261 W 200 N
- 232 Hidden Creek Dr Unit 4
- 232 Hidden Creek Dr
- 234 Hidden Creek Dr
- 236 Hidden Creek Dr
- 263 W 200 N
- 228 Hidden Creek Dr
- 229 W 200 N
- 240 Hidden Creek Dr
- 185 W 200 N
- 226 Hidden Creek Dr
- 224 Hidden Creek Dr
- 258 W 200 N
- 244 W 200 N
- 242 Hidden Creek Dr
- 277 W 200 N
- 244 Hidden Creek Dr
- 244 Hidden Creek Dr Unit 9
- 230 W 200 N