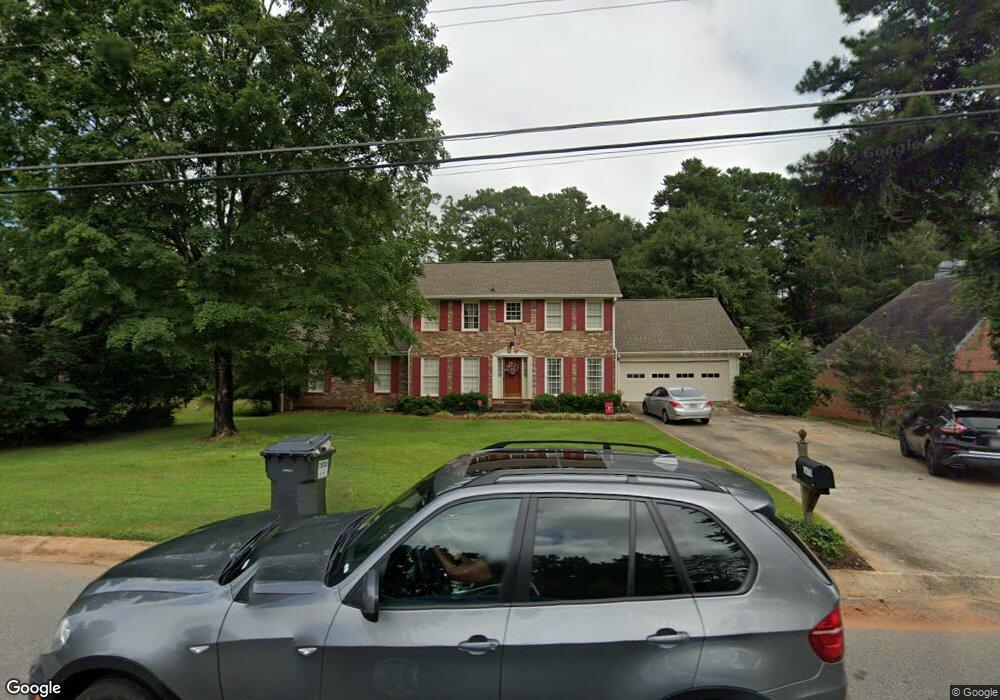
2470 Fieldstone Dr SE Conyers, GA 30013
Estimated Value: $313,000 - $353,000
4
Beds
4
Baths
2,807
Sq Ft
$119/Sq Ft
Est. Value
About This Home
This home is located at 2470 Fieldstone Dr SE, Conyers, GA 30013 and is currently estimated at $333,043, approximately $118 per square foot. 2470 Fieldstone Dr SE is a home located in Rockdale County with nearby schools including Peek's Chapel Elementary School, Memorial Middle School, and Salem High School.
Ownership History
Date
Name
Owned For
Owner Type
Purchase Details
Closed on
Mar 18, 2022
Sold by
Rhymer William
Bought by
Rhymer William and Rhymer Judy Lynn
Current Estimated Value
Home Financials for this Owner
Home Financials are based on the most recent Mortgage that was taken out on this home.
Original Mortgage
$486,000
Outstanding Balance
$482,143
Interest Rate
3.64%
Mortgage Type
FHA
Estimated Equity
-$149,100
Purchase Details
Closed on
Oct 3, 2014
Sold by
Rhymer Judy Lynn
Bought by
Rhymer William
Purchase Details
Closed on
Apr 6, 1993
Sold by
Craft Thomas A and Craft Joyce S
Bought by
Rhymer William and Rhymer Judy Lynn
Home Financials for this Owner
Home Financials are based on the most recent Mortgage that was taken out on this home.
Original Mortgage
$127,100
Interest Rate
7.57%
Mortgage Type
FHA
Create a Home Valuation Report for This Property
The Home Valuation Report is an in-depth analysis detailing your home's value as well as a comparison with similar homes in the area
Home Values in the Area
Average Home Value in this Area
Purchase History
| Date | Buyer | Sale Price | Title Company |
|---|---|---|---|
| Rhymer William | -- | -- | |
| Rhymer William | -- | -- | |
| Rhymer William | $128,000 | -- |
Source: Public Records
Mortgage History
| Date | Status | Borrower | Loan Amount |
|---|---|---|---|
| Open | Rhymer William | $486,000 | |
| Closed | Rhymer William | $486,000 | |
| Previous Owner | Rhymer William | $127,100 |
Source: Public Records
Tax History Compared to Growth
Tax History
| Year | Tax Paid | Tax Assessment Tax Assessment Total Assessment is a certain percentage of the fair market value that is determined by local assessors to be the total taxable value of land and additions on the property. | Land | Improvement |
|---|---|---|---|---|
| 2024 | $2,999 | $149,160 | $22,880 | $126,280 |
| 2023 | $3,037 | $128,080 | $23,200 | $104,880 |
| 2022 | $2,530 | $108,360 | $19,320 | $89,040 |
| 2021 | $2,248 | $92,040 | $15,600 | $76,440 |
| 2020 | $2,080 | $83,680 | $12,360 | $71,320 |
| 2019 | $1,544 | $64,560 | $6,400 | $58,160 |
| 2018 | $1,440 | $60,880 | $5,600 | $55,280 |
| 2017 | $1,315 | $56,280 | $5,600 | $50,680 |
| 2016 | $1,173 | $54,840 | $5,600 | $49,240 |
| 2015 | $1,121 | $52,960 | $7,200 | $45,760 |
| 2014 | $987 | $52,280 | $5,800 | $46,480 |
| 2013 | -- | $56,440 | $10,000 | $46,440 |
Source: Public Records
Map
Nearby Homes
- 2487 Highland Dr SE
- 2496 Highland Dr SE
- 2491 Highland Golf Course Cir SE
- 295 Limestone Cir
- 317 Limestone Cir
- 297 Limestone Cir
- 303 Limestone Cir
- 307 Limestone Cir
- 2561 Highland Golf Course Dr SE
- 278 Limestone Cir
- 272 Limestone Cir
- 268 Limestone Cir
- 274 Limestone Cir
- 270 Limestone Cir
- 276 Limestone Cir
- 280 Limestone Cir
- 284 Limestone Cir
- 130 Plant Rd
- 700 Plant Rd
- 200 Plant Rd
- 2462 Fieldstone Dr SE
- 2478 Fieldstone Dr SE
- 2475 Fieldstone Dr SE
- 2467 Fieldstone Dr SE
- 2482 Fieldstone Dr SE
- 2454 Fieldstone Dr SE
- 2476 Highland Dr SE
- 2490 Fieldstone Dr SE
- 2476 Highland Golf Course Dr SE
- 2476 Highland Golf Crs Dr SE
- 2489 Fieldstone Dr SE
- 2466 Highland Golf Crs Dr SE
- 2426 Fieldstone Dr SE
- 2470 Highland Dr SE
- 2446 Fieldstone Dr SE
- 2486 Highland Golf Crs Dr SE
- 2416 Fieldstone Dr SE
- 2498 Fieldstone Dr SE
- 2464 Highland Dr SE
- 1810 Emory Ln Unit 94