NOT LISTED FOR SALE

2470 Reindeer Ave NW Salem, OR 97304

West Salem Neighborhood

Estimated Value: $532,000 - $546,000

3 Beds
3 Baths
1,997 Sq Ft
$270/Sq Ft Est. Value

Last Sold February 08, 2013

Last sale price $249,000 $125 Per Sq Ft

Est. 116% increase in value since last sale

Current estimated payment $3,357/month

About This Home

As of February 2013

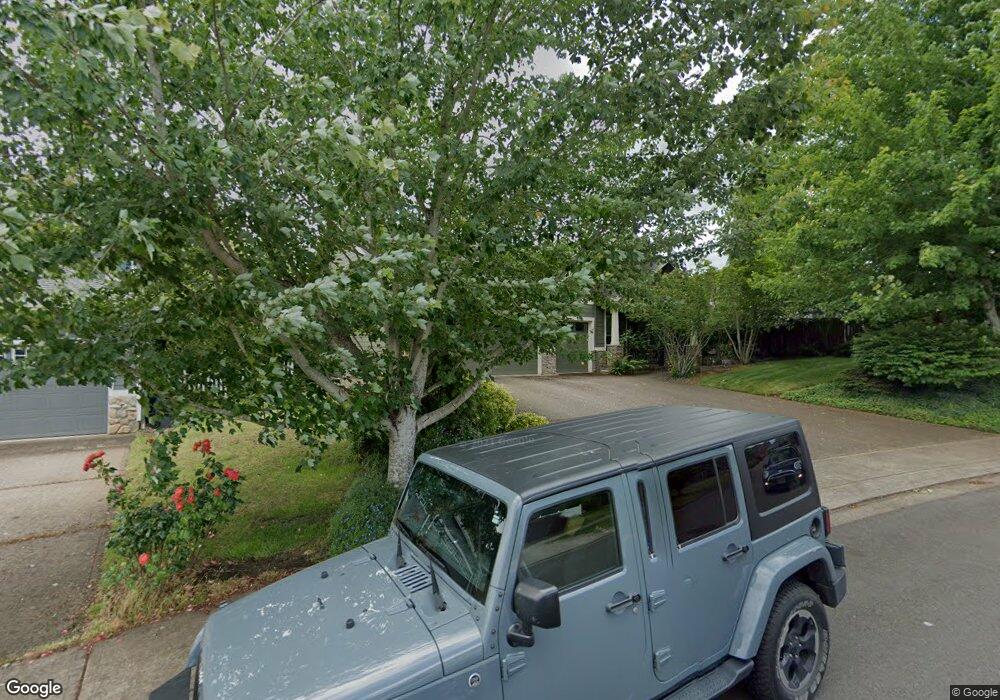
This home is located at 2470 Reindeer Ave NW, Salem, OR 97304 and is currently estimated at $539,082, approximately $269 per square foot. 2470 Reindeer Ave NW is a home located in Polk County with nearby schools including Myers Elementary School, Walker Middle School, and West Salem High School.

Ownership History

Date Name Owned For Owner Type

Purchase Details

Listed on
Jun 12, 2012
Closed on
Feb 8, 2013
Sold by
Johnson Chad and Johnson Krysten
Bought by
Cummings William S
Seller's Agent
Greg Messick
REALTYNET
Buyer's Agent
Ty Hilderbrand
REALTY ONE GROUP WILLAMETTE VALLEY
List Price
$249,000
Sold Price
$249,000
Current Estimated Value
$539,082

Home Financials for this Owner

Home Financials are based on the most recent Mortgage that was taken out on this home.
Estimated Appreciation
$290,082
Avg. Annual Appreciation
6.29%
Original Mortgage
$244,489
Outstanding Balance
$169,960
Interest Rate
3.29%
Mortgage Type
FHA
Estimated Equity
$369,122
Source: Public Records

Range of Values:

Collateral Analytics

Collateral Analytics Collateral Analytics AVMs (Automated Valuation Model) employ a number of statistical approaches combined with neighborhood-specific comparable selection guarantees the most up-to-date and precise valuations.

Not Available

Collateral Analytics does not have data for the current month. Please view the chart for historical values.

ICE

ICE Mortgage Technology ICE Mortgage Technology’s AVM (Automated Valuation Model) is a state-of-the-art online residential property valuation tool that provides a quick and accurate estimate of the value of almost any home in the U.S.

Not Available

ICE Mortgage Technology does not have data for the current month. Please view the chart for historical values.

First American

First American First American Data & Analytics’ next-generation AVM combines unrivaled data assets with a blended ensemble of valuation models to produce highly accurate, reliable valuations you can trust.

Not Available

First American does not have data for the current month. Please view the chart for historical values.

Quantarium

Quantarium Quantarium’s valuation service, repeatedly proven the industry’s most accurate and comprehensive, is supercharged with a self-learning and auto-tuning AI engine that continually becomes smarter and more accurate as it processes daily inputs from the industry’s leading RE data lake.

Not Available

Quantarium does not have data for the current month. Please view the chart for historical values.

Average Value
Not Available
List Price
Sold Price
Create a Home Valuation Report for This Property
The Home Valuation Report is an in-depth analysis detailing your home's value as well as a comparison with similar homes in the area

Home Values in the Area

Source: Public Records

Average Home Value in this Area


Source: Public Records

Purchase History

Date Buyer Sale Price Title Company
Cummings William S $249,000 Amerititle
Source: Public Records

Mortgage History

Date Status Borrower Loan Amount
Open Cummings William S $244,489
Source: Public Records

Property History

Date Event Price List to Sale Price per Sq Ft Prior Sale
02/08/2013 02/08/13 Sold $249,000 0.0% $125 / Sq Ft View Prior Sale
01/08/2013 01/08/13 Pending -- -- --
06/12/2012 06/12/12 For Sale $249,000 -- $125 / Sq Ft

Tax History Compared to Growth

Source: Public Records

Tax History

Year Tax Paid Tax Assessment Tax Assessment Total Assessment is a certain percentage of the fair market value that is determined by local assessors to be the total taxable value of land and additions on the property. Land Improvement
2025 $5,847 $319,590 $75,630 $243,960
2024 $5,847 $310,290 $73,430 $236,860
2023 $5,678 $301,260 $71,300 $229,960
2022 $5,496 $292,490 $69,220 $223,270
2021 $5,339 $283,980 $67,200 $216,780
2020 $5,181 $275,710 $65,250 $210,460
2019 $5,000 $267,680 $63,350 $204,330
2018 $4,917 $259,890 $61,500 $198,390
2017 $4,431 $252,330 $59,710 $192,620
2016 $4,326 $244,990 $57,970 $187,020
2015 $4,362 $237,860 $56,280 $181,580
2014 $4,168 $230,940 $54,640 $176,300
Source: Public Records

Agents Affiliated with this Home

  • Section Image
  • Section Image
See All Agents

Map