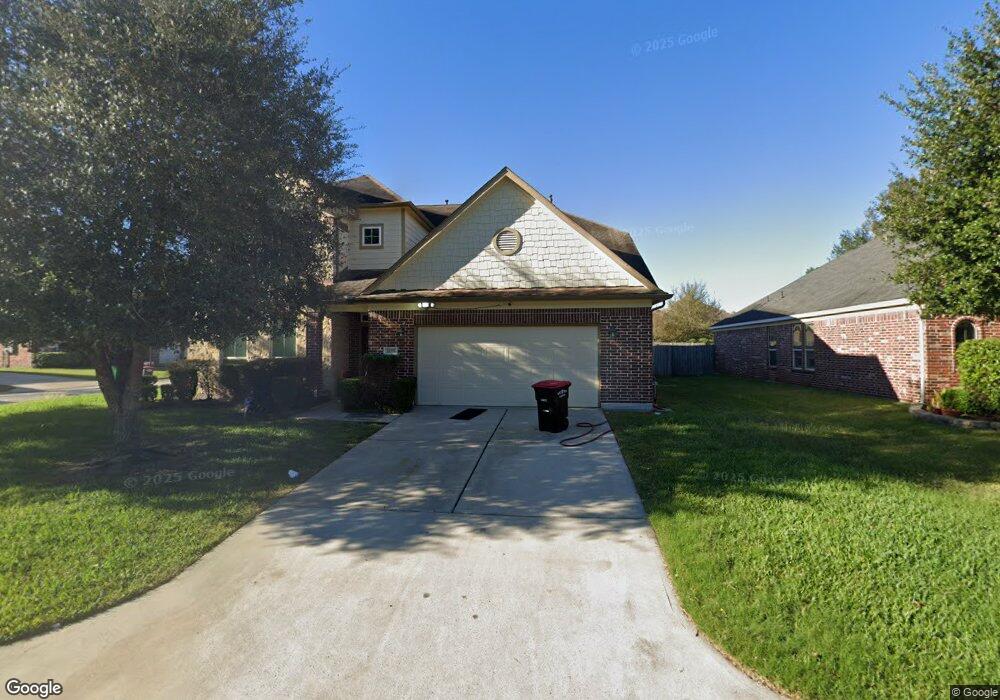
24703 Broad Branch Ct Spring, TX 77373
Estimated Value: $388,000 - $433,000
4
Beds
3
Baths
3,803
Sq Ft
$106/Sq Ft
Est. Value
About This Home
This home is located at 24703 Broad Branch Ct, Spring, TX 77373 and is currently estimated at $401,849, approximately $105 per square foot. 24703 Broad Branch Ct is a home with nearby schools including John Winship Elementary School, Twin Creeks Middle School, and Spring High School.
Ownership History
Date
Name
Owned For
Owner Type
Purchase Details
Closed on
Oct 12, 2021
Sold by
Kadura Ugonnia L
Bought by
Kaduru Charles
Current Estimated Value
Purchase Details
Closed on
May 5, 2021
Sold by
Kaduru Charles
Bought by
Kaduru Ugonnia L
Purchase Details
Closed on
Feb 8, 2021
Sold by
Kaduru Gillian
Bought by
Kaduru Charles
Purchase Details
Closed on
Dec 20, 2013
Sold by
Long Lake Ltd
Bought by
Kaduru Charles K and Kaduru Gillian C
Home Financials for this Owner
Home Financials are based on the most recent Mortgage that was taken out on this home.
Original Mortgage
$220,866
Interest Rate
4.36%
Mortgage Type
FHA
Purchase Details
Closed on
Sep 18, 2013
Sold by
Woodmere Development Co Ltd
Bought by
Long Lake Ltd
Create a Home Valuation Report for This Property
The Home Valuation Report is an in-depth analysis detailing your home's value as well as a comparison with similar homes in the area
Home Values in the Area
Average Home Value in this Area
Purchase History
| Date | Buyer | Sale Price | Title Company |
|---|---|---|---|
| Kaduru Charles | -- | None Available | |
| Kaduru Ugonnia L | -- | None Available | |
| Kaduru Charles | -- | None Available | |
| Kaduru Charles K | -- | South Land Title Llc | |
| Long Lake Ltd | -- | South Land Title Llc |
Source: Public Records
Mortgage History
| Date | Status | Borrower | Loan Amount |
|---|---|---|---|
| Previous Owner | Kaduru Charles K | $220,866 |
Source: Public Records
Tax History
| Year | Tax Paid | Tax Assessment Tax Assessment Total Assessment is a certain percentage of the fair market value that is determined by local assessors to be the total taxable value of land and additions on the property. | Land | Improvement |
|---|---|---|---|---|
| 2025 | $10,088 | $410,608 | $56,724 | $353,884 |
| 2024 | $10,088 | $383,236 | $56,724 | $326,512 |
| 2023 | $10,088 | $393,658 | $56,724 | $336,934 |
| 2022 | $10,072 | $373,586 | $32,473 | $341,113 |
| 2021 | $7,417 | $316,345 | $32,473 | $283,872 |
| 2020 | $7,107 | $286,409 | $32,473 | $253,936 |
| 2019 | $6,671 | $218,000 | $32,562 | $185,438 |
| 2018 | $5,829 | $218,000 | $32,562 | $185,438 |
| 2017 | $6,622 | $218,000 | $32,562 | $185,438 |
| 2016 | $6,622 | $218,000 | $32,562 | $185,438 |
| 2015 | $6,914 | $236,600 | $32,562 | $204,038 |
| 2014 | $6,914 | $218,166 | $32,562 | $185,604 |
Source: Public Records
Map
Nearby Homes
- 2619 Colony Haven Cir
- 24710 Fawn Ridge Forest Dr
- 2602 Fort Settlement Trail
- 24515 Flora Meadow Dr
- 2514 Broad Timbers Dr
- 2739 Barrington Branch Dr
- 24714 Longwood Forest Dr
- 3330 Spring Creek Dr
- 24611 Fort Timbers Ct
- 2526 Spring Dusk Ln
- 2227 Lazy Trail Path Ct
- 2819 Bradbury Hills Dr
- 24715 Native Forest Ct
- 26506 Cypresswood Dr
- 2823 Skerne Forest Dr
- 2306 Two Trail Dr
- 2902 Skerne Forest Dr
- 2823 Autumn Springs Ln
- 2402 Spring Dusk Ln
- 3019 Knotty Forest Dr
- 24707 Broad Branch Ct
- 24711 Broad Branch Ct
- 24706 E Burnaby Cir
- 24702 E Burnaby Cir
- 2606 Deer Forest Dr
- 2606 Deer Forest
- 2602 Deer Forest Dr
- 24702 Broad Branch Ct
- 2602 Deer Forest
- 2602 Deer Forest Unit DR
- 24710 E Burnaby Cir
- 24706 Broad Branch Ct
- 24715 Broad Branch Ct
- 2526 Deer Forest Dr
- 2526 Deer Forest
- 3036 Broad Branch Ct
- 2614 Deer Forest Dr
- 24714 E Burnaby Cir
- 24714 E Burnaby Cir Unit 1
- 2522 Deer Forest Dr
Your Personal Tour Guide
Ask me questions while you tour the home.