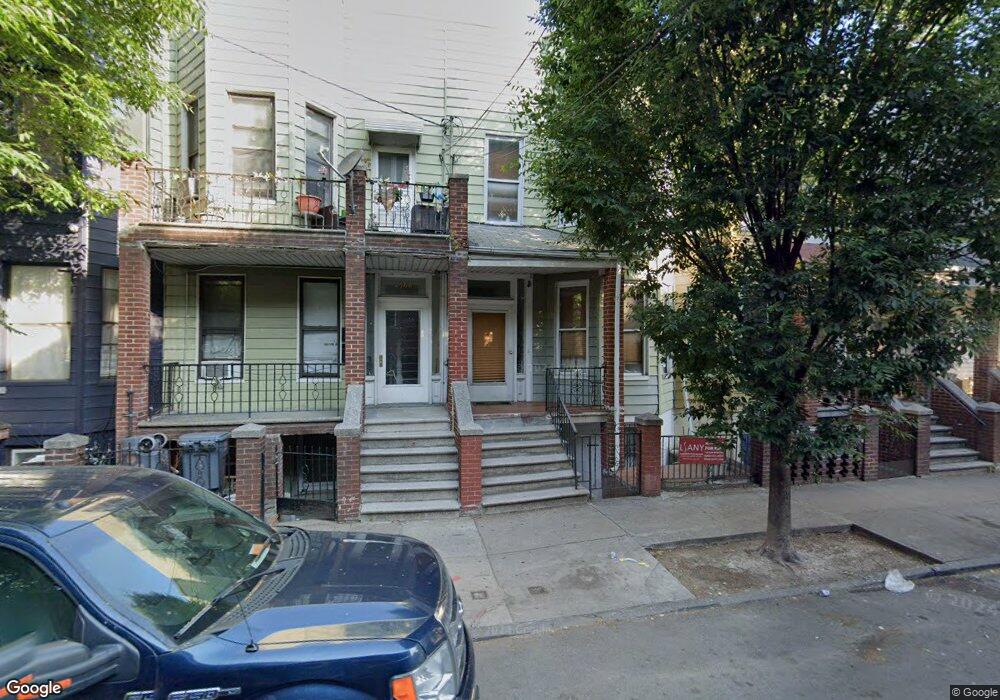
2471 Cambreleng Ave Bronx, NY 10458
Belmont NeighborhoodEstimated Value: $619,661 - $759,000
--
Bed
--
Bath
1,404
Sq Ft
$499/Sq Ft
Est. Value
About This Home
This home is located at 2471 Cambreleng Ave, Bronx, NY 10458 and is currently estimated at $701,165, approximately $499 per square foot. 2471 Cambreleng Ave is a home located in Bronx County with nearby schools including P.S. 205 Fiorello LaGuardia and Thomas C Giordano Middleschool 45.
Ownership History
Date
Name
Owned For
Owner Type
Purchase Details
Closed on
Feb 13, 2010
Sold by
Espinal Maritza and Fernandez Jerry
Bought by
Fernandez Rosa and Nunez Herminio A
Current Estimated Value
Purchase Details
Closed on
Mar 11, 2005
Sold by
Sorid Susan
Bought by
Espinal Maritza and Fernandez Jerry
Home Financials for this Owner
Home Financials are based on the most recent Mortgage that was taken out on this home.
Original Mortgage
$351,140
Interest Rate
5.83%
Mortgage Type
Purchase Money Mortgage
Purchase Details
Closed on
Mar 3, 2004
Sold by
Jimenez Roque and Santaella Sharon
Bought by
Sorid Susan
Purchase Details
Closed on
Mar 26, 1999
Sold by
Rodriguez Rodger and Rodriguez Rosa
Bought by
Silva Carmelo and Santaella Sharon
Home Financials for this Owner
Home Financials are based on the most recent Mortgage that was taken out on this home.
Original Mortgage
$204,857
Interest Rate
7.85%
Mortgage Type
FHA
Create a Home Valuation Report for This Property
The Home Valuation Report is an in-depth analysis detailing your home's value as well as a comparison with similar homes in the area
Home Values in the Area
Average Home Value in this Area
Purchase History
| Date | Buyer | Sale Price | Title Company |
|---|---|---|---|
| Fernandez Rosa | $326,000 | -- | |
| Espinal Maritza | $370,000 | -- | |
| Sorid Susan | $175,000 | -- | |
| Silva Carmelo | $205,000 | Commonwealth Land Title Ins |
Source: Public Records
Mortgage History
| Date | Status | Borrower | Loan Amount |
|---|---|---|---|
| Previous Owner | Espinal Maritza | $351,140 | |
| Previous Owner | Silva Carmelo | $204,857 |
Source: Public Records
Tax History Compared to Growth
Tax History
| Year | Tax Paid | Tax Assessment Tax Assessment Total Assessment is a certain percentage of the fair market value that is determined by local assessors to be the total taxable value of land and additions on the property. | Land | Improvement |
|---|---|---|---|---|
| 2025 | $4,498 | $23,717 | $4,357 | $19,360 |
| 2024 | $4,498 | $22,394 | $3,727 | $18,667 |
| 2023 | $4,293 | $21,139 | $3,787 | $17,352 |
| 2022 | $4,220 | $40,560 | $6,900 | $33,660 |
| 2021 | $4,408 | $33,120 | $6,900 | $26,220 |
| 2020 | $4,183 | $35,580 | $6,900 | $28,680 |
| 2019 | $3,904 | $28,920 | $6,900 | $22,020 |
| 2018 | $3,591 | $17,616 | $4,482 | $13,134 |
| 2017 | $3,591 | $17,616 | $5,039 | $12,577 |
| 2016 | $3,490 | $17,456 | $5,904 | $11,552 |
| 2015 | $1,785 | $16,470 | $6,507 | $9,963 |
| 2014 | $1,785 | $15,552 | $6,570 | $8,982 |
Source: Public Records
Map
Nearby Homes
- 2471 Crotona Ave
- 45-44 E 189th St
- 554 E 191st St Unit 1,2,3
- 2301 Bathgate Ave
- 505 E 183rd St
- 620 E 182nd St
- - - E 183rd Street & Bassford Ave
- 2259 Bassford Ave
- 2158 Hughes Ave
- 2255 Bathgate Ave
- 2243 Bathgate Ave
- 2249 Bassford Ave
- 805 E 182nd St Unit 4E
- 618 E 181st St
- 610 E 181st St
- 731 E 181st St
- 2611 Decatur Ave
- 2503 Marion Ave
- 2139 Mapes Ave
- 350 E 193rd St
- 2473 Cambreleng Ave
- 2469 Cambreleng Ave
- 2467 Cambreleng Ave
- 2467 Cambreleng Ave Unit 3
- 2475 Cambreleng Ave
- 2477 Cambreleng Ave
- 2465 Cambreleng Ave
- 2479 Cambreleng Ave
- 657 E 189th St
- 657 E 189th St
- 655 E 189th St
- 2481 Cambreleng Ave
- 2483 Cambreleng Ave Unit 13
- 2483 Cambreleng Ave Unit 17
- 2483 Cambreleng Ave Unit 16
- 2496 Belmont Ave
- 2472 Cambreleng Ave
- 2474 Cambreleng Ave
- 2483-2489 Cambreleng Ave
- 2490 Belmont Ave Unit 11