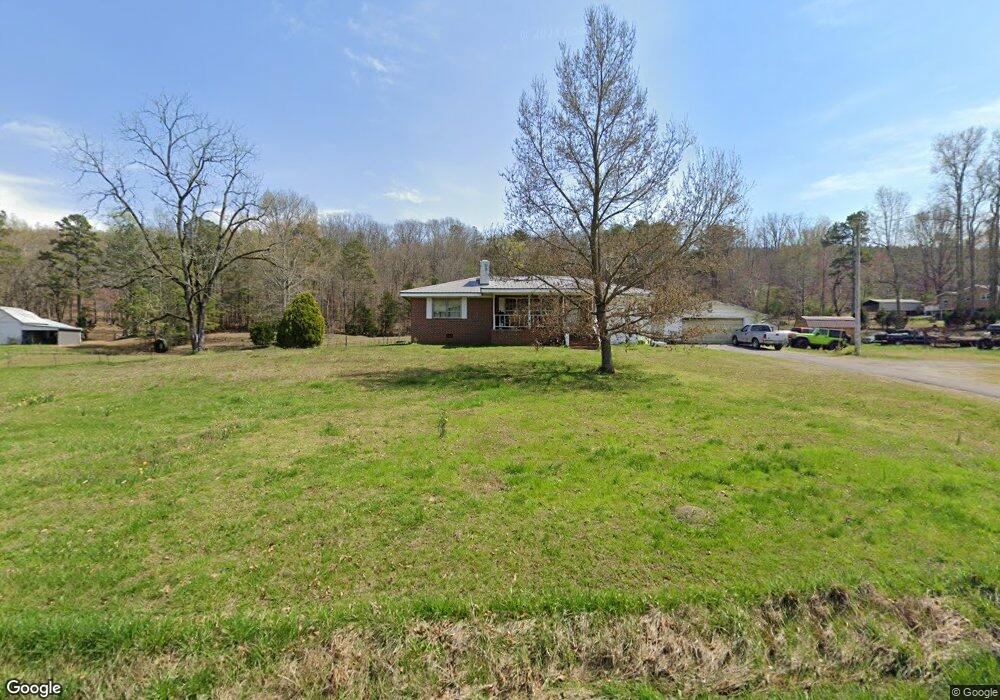
2471 Ringgold Rd La Fayette, GA 30728
Noble NeighborhoodEstimated Value: $270,000 - $314,900
3
Beds
2
Baths
1,230
Sq Ft
$241/Sq Ft
Est. Value
About This Home
This home is located at 2471 Ringgold Rd, La Fayette, GA 30728 and is currently estimated at $296,225, approximately $240 per square foot. 2471 Ringgold Rd is a home located in Walker County with nearby schools including Rock Spring Elementary School, Lafayette High School, and Alice M Daley Adventist School.
Ownership History
Date
Name
Owned For
Owner Type
Purchase Details
Closed on
Apr 21, 2011
Sold by
Hsbc Mtg Svcs Inc
Bought by
Rowlls Anthony C
Current Estimated Value
Home Financials for this Owner
Home Financials are based on the most recent Mortgage that was taken out on this home.
Original Mortgage
$103,595
Outstanding Balance
$71,505
Interest Rate
4.81%
Mortgage Type
New Conventional
Estimated Equity
$224,720
Purchase Details
Closed on
Jul 6, 2010
Sold by
Miller Catheran L
Bought by
Hsbc Mtg Svcs
Purchase Details
Closed on
Mar 22, 2004
Sold by
Deemer Daniel Richard and Deemer Bessie
Bought by
Miller Catheran L and Miller Maurice E
Purchase Details
Closed on
May 12, 1995
Sold by
Hamilton Shirley J
Bought by
Deemer Daniel Richard and Deemer Bessie
Purchase Details
Closed on
May 2, 1994
Sold by
Hamilton James
Bought by
Hamilton Shirley J
Purchase Details
Closed on
Jan 1, 1972
Bought by
Hamilton James
Create a Home Valuation Report for This Property
The Home Valuation Report is an in-depth analysis detailing your home's value as well as a comparison with similar homes in the area
Home Values in the Area
Average Home Value in this Area
Purchase History
| Date | Buyer | Sale Price | Title Company |
|---|---|---|---|
| Rowlls Anthony C | $99,970 | -- | |
| Hsbc Mtg Svcs | $97,516 | -- | |
| Miller Catheran L | $130,000 | -- | |
| Deemer Daniel Richard | $80,000 | -- | |
| Hamilton Shirley J | -- | -- | |
| Hamilton James | -- | -- |
Source: Public Records
Mortgage History
| Date | Status | Borrower | Loan Amount |
|---|---|---|---|
| Open | Hsbc Mtg Svcs | $103,595 |
Source: Public Records
Tax History Compared to Growth
Tax History
| Year | Tax Paid | Tax Assessment Tax Assessment Total Assessment is a certain percentage of the fair market value that is determined by local assessors to be the total taxable value of land and additions on the property. | Land | Improvement |
|---|---|---|---|---|
| 2024 | $2,582 | $112,731 | $25,208 | $87,523 |
| 2023 | $2,427 | $103,095 | $20,007 | $83,088 |
| 2022 | $2,262 | $92,996 | $21,198 | $71,798 |
| 2021 | $1,996 | $73,878 | $21,198 | $52,680 |
| 2020 | $1,775 | $62,970 | $21,198 | $41,772 |
| 2019 | $1,808 | $62,970 | $21,198 | $41,772 |
| 2018 | $1,666 | $62,970 | $21,198 | $41,772 |
| 2017 | $2,034 | $62,970 | $21,198 | $41,772 |
| 2016 | $1,671 | $62,970 | $21,198 | $41,772 |
| 2015 | $1,317 | $45,571 | $18,324 | $27,247 |
| 2014 | $1,215 | $45,571 | $18,324 | $27,247 |
| 2013 | -- | $45,570 | $18,324 | $27,246 |
Source: Public Records
Map
Nearby Homes
- 1585 E Reed Rd
- 1186 E Reed Rd
- 58 Willow Cir
- 23 Forrestway Dr
- 0 Clyde Byrd Rd
- 121 Stock Dog Ln
- 23 Raleigh Dr
- 4582 Highway N 27
- 4654 Us Highway 27
- 450 Arnold Ln
- 0 Colbert Hollow Rd Unit 1513202
- 3032 Lake Howard Rd
- 0 E Warren Rd Unit RTC2681365
- 0 E Warren Rd Unit 1395828
- 0 Veeler Rd Unit 10628696
- 0 Veeler Rd Unit 1522679
- 474 Lake Howard Rd
- Lot 4 Pine Farm Dr
- 1934 Round Pond Rd
- 516 W Reed Rd
- 2221 Ringgold Rd
- 2508 Ringgold Rd
- 2504 Ringgold Rd
- 2531 Ringgold Rd
- 2415 Ringgold Rd
- 2539 Ringgold Rd
- 2394 Ringgold Rd
- 2374 Ringgold Rd
- 2359 Ringgold Rd
- 2611 Ringgold Rd
- 2324 Ringgold Rd
- 2566 Ringgold Rd
- 1 Cordell Rd
- 1 Cordell Rd Unit TR. 3
- 1 Cordell Rd Unit TR. 2
- 0 Cordell Rd Unit 22987185
- 0 Cordell Rd Unit 11456815
- 0 Cordell Rd Unit LOT 1079549
- 0 Cordell Rd Unit 1032931
- 0 Cordell Rd Unit 7283690