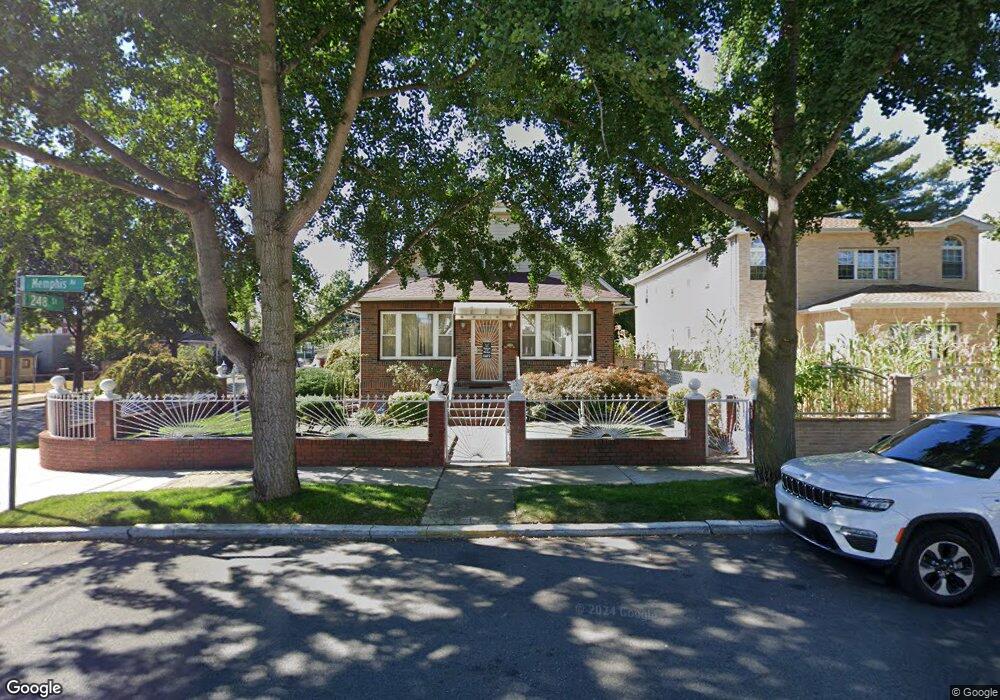
24716 Memphis Ave Rosedale, NY 11422
Rosedale NeighborhoodEstimated Value: $936,887 - $1,139,000
Studio
--
Bath
2,452
Sq Ft
$431/Sq Ft
Est. Value
About This Home
This home is located at 24716 Memphis Ave, Rosedale, NY 11422 and is currently estimated at $1,056,972, approximately $431 per square foot. 24716 Memphis Ave is a home located in Queens County with nearby schools including P.S. / M.S. 138 Sunrise, Collaborative Arts Middle School, and Success Academy Charter School - Rosedale.
Ownership History
Date
Name
Owned For
Owner Type
Purchase Details
Closed on
Aug 3, 2024
Sold by
Mcfadzean Beverly and Mcfadzean Peter
Bought by
Beverly Mcfadzean Trustees Of The Peter and Peter Anthony Mcfadzean Trustees Of The
Current Estimated Value
Purchase Details
Closed on
Jun 7, 2001
Sold by
Mcfadzean Peter
Bought by
Mcfadzean Peter and Mcfadzean Beverly
Home Financials for this Owner
Home Financials are based on the most recent Mortgage that was taken out on this home.
Original Mortgage
$236,000
Interest Rate
7.14%
Purchase Details
Closed on
Oct 6, 1997
Sold by
Delrio Luis and Delrio Mariela
Bought by
Mcfadzean Peter
Home Financials for this Owner
Home Financials are based on the most recent Mortgage that was taken out on this home.
Original Mortgage
$210,500
Interest Rate
7.14%
Mortgage Type
FHA
Create a Home Valuation Report for This Property
The Home Valuation Report is an in-depth analysis detailing your home's value as well as a comparison with similar homes in the area
Home Values in the Area
Average Home Value in this Area
Purchase History
| Date | Buyer | Sale Price | Title Company |
|---|---|---|---|
| Beverly Mcfadzean Trustees Of The Peter | -- | -- | |
| Beverly Mcfadzean Trustees Of The Peter | -- | -- | |
| Mcfadzean Peter | -- | -- | |
| Mcfadzean Peter | -- | -- | |
| Mcfadzean Peter | $230,000 | Commonwealth Land Title Ins | |
| Mcfadzean Peter | $230,000 | Commonwealth Land Title Ins |
Source: Public Records
Mortgage History
| Date | Status | Borrower | Loan Amount |
|---|---|---|---|
| Previous Owner | Mcfadzean Peter | $236,000 | |
| Previous Owner | Mcfadzean Peter | $210,500 |
Source: Public Records
Tax History
| Year | Tax Paid | Tax Assessment Tax Assessment Total Assessment is a certain percentage of the fair market value that is determined by local assessors to be the total taxable value of land and additions on the property. | Land | Improvement |
|---|---|---|---|---|
| 2025 | $8,310 | $42,997 | $8,675 | $34,322 |
| 2024 | $8,310 | $41,374 | $8,906 | $32,468 |
| 2023 | $7,840 | $39,035 | $8,333 | $30,702 |
| 2022 | $7,352 | $51,840 | $12,360 | $39,480 |
| 2021 | $7,541 | $55,440 | $12,360 | $43,080 |
| 2020 | $7,584 | $55,140 | $12,360 | $42,780 |
| 2019 | $7,212 | $54,420 | $12,360 | $42,060 |
| 2018 | $6,333 | $32,529 | $9,683 | $22,846 |
| 2017 | $5,956 | $30,688 | $11,110 | $19,578 |
| 2016 | $5,659 | $30,688 | $11,110 | $19,578 |
| 2015 | $3,272 | $29,859 | $9,493 | $20,366 |
| 2014 | $3,272 | $28,732 | $8,506 | $20,226 |
Source: Public Records
Map
Nearby Homes
- 248-18 Memphis Ave
- 140-36 247th St
- 14224 250th St
- 143-06 243rd St
- 251-20 Memphis Ave
- 13918 249th St
- 139-21 246th St
- 241-06 141st Ave
- 13917 250th St
- 139-16 Caney Ln
- 13834 247th St
- 13929 254th St
- 141-33 255th St
- 24361 Mayda Rd
- 24909 Mayda Rd
- 14101 255th St
- 25340 147th Ave
- 253-22 147th Ave
- 24018 144th Ave
- 25711 147th Ave
- 24712 Memphis Ave
- 14212 248th St
- 24802 Memphis Ave
- 24708 Memphis Ave
- 14220 248th St
- 14211 248th St
- 247-02 Memphis Ave
- 24808 Memphis Ave
- 14211 248th St
- 14115 247th St
- 24702 Memphis Ave
- 24717 Memphis Ave
- 248-01 Memphis Ave Unit 2
- 248-01 Memphis Ave
- 24711 Memphis Ave
- 14217 248th St
- 14226 248th St
- 14121 247th St
- 24801 Memphis Ave
- 24707 Memphis Ave