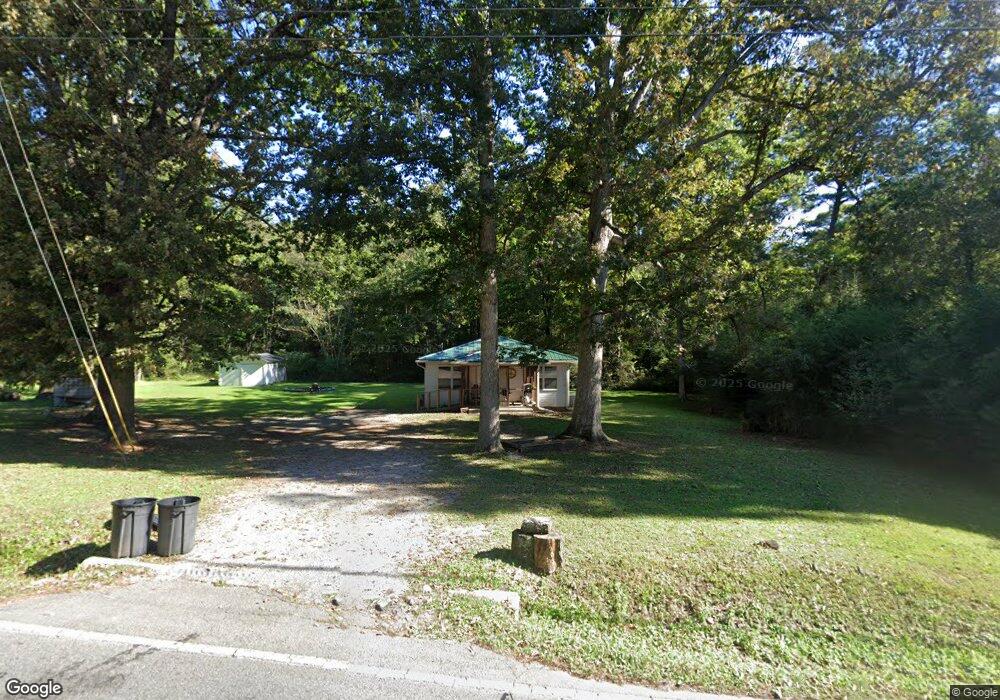
2472 N Highway 341 Rossville, GA 30741
Estimated Value: $164,000 - $213,000
--
Bed
--
Bath
959
Sq Ft
$207/Sq Ft
Est. Value
About This Home
This home is located at 2472 N Highway 341, Rossville, GA 30741 and is currently estimated at $198,750, approximately $207 per square foot. 2472 N Highway 341 is a home with nearby schools including Cherokee Ridge Elementary School, Chattanooga Valley Middle School, and Ridgeland High School.
Ownership History
Date
Name
Owned For
Owner Type
Purchase Details
Closed on
Sep 16, 2014
Sold by
Howard Richard K
Bought by
Howard Richard J
Current Estimated Value
Home Financials for this Owner
Home Financials are based on the most recent Mortgage that was taken out on this home.
Original Mortgage
$60,000
Outstanding Balance
$45,951
Interest Rate
4.15%
Mortgage Type
New Conventional
Estimated Equity
$152,799
Purchase Details
Closed on
Jul 9, 2004
Sold by
Parker Luther Fred
Bought by
Howard Richard K
Purchase Details
Closed on
Nov 26, 1991
Sold by
Dangler Kirby L I
Bought by
Parker Luther Fred
Purchase Details
Closed on
Aug 6, 1991
Sold by
Davis Rosie C
Bought by
Dangler Kirby L I
Purchase Details
Closed on
Jun 21, 1991
Sold by
Collins Wesley M
Bought by
Davis Michael Glenn and Davis
Purchase Details
Closed on
Jan 1, 1972
Bought by
Collins Wesley M
Create a Home Valuation Report for This Property
The Home Valuation Report is an in-depth analysis detailing your home's value as well as a comparison with similar homes in the area
Home Values in the Area
Average Home Value in this Area
Purchase History
| Date | Buyer | Sale Price | Title Company |
|---|---|---|---|
| Howard Richard J | $75,000 | -- | |
| Howard Richard K | $40,000 | -- | |
| Parker Luther Fred | $30,000 | -- | |
| Dangler Kirby L I | $17,000 | -- | |
| Davis Rosie C | -- | -- | |
| Davis Michael Glenn | -- | -- | |
| Collins Wesley M | -- | -- |
Source: Public Records
Mortgage History
| Date | Status | Borrower | Loan Amount |
|---|---|---|---|
| Open | Howard Richard J | $60,000 |
Source: Public Records
Tax History Compared to Growth
Tax History
| Year | Tax Paid | Tax Assessment Tax Assessment Total Assessment is a certain percentage of the fair market value that is determined by local assessors to be the total taxable value of land and additions on the property. | Land | Improvement |
|---|---|---|---|---|
| 2024 | $1,528 | $68,623 | $26,010 | $42,613 |
| 2023 | $1,450 | $63,526 | $23,223 | $40,303 |
| 2022 | $996 | $38,995 | $11,558 | $27,437 |
| 2021 | $823 | $28,522 | $11,558 | $16,964 |
| 2020 | $788 | $26,165 | $11,558 | $14,607 |
| 2019 | $802 | $26,165 | $11,558 | $14,607 |
| 2018 | $692 | $26,165 | $11,558 | $14,607 |
| 2017 | $862 | $25,767 | $11,160 | $14,607 |
| 2016 | $761 | $25,767 | $11,160 | $14,607 |
| 2015 | $705 | $22,075 | $8,192 | $13,883 |
| 2014 | $627 | $22,264 | $8,192 | $14,072 |
| 2013 | -- | $22,264 | $8,192 | $14,072 |
Source: Public Records
Map
Nearby Homes
- 201 Laurelwood Cir
- 2751 N Highway 341
- 157 W Lewis St
- 946 Greenhill Dr
- 413 Harp Switch Rd
- 3269 N Highway 341
- 733 Crestridge Dr
- 1343 N Highway 341
- 301 Hidden Oaks Dr
- 320 Marble Top Rd
- 221 Highland Dr
- 144 N Victor Dr
- 932 Johnson Rd
- 705 Scenic Dr
- 3509 N Highway N 341
- 433 Stanford Dr
- 1080 Harp Switch Rd
- 757 W Schmitt Rd
- 923 Crest Dr
- 0 Roundtree Ct Unit 1514898
- 2524 N Highway 341
- 2509 N Highway 341
- 2529 N Highway 341
- 2457 N Highway 341
- 2548 N Hwy 341
- 2548 N Highway 341
- 2509 Georgia 341
- 2550 N Highway 341
- 2557 N Highway 341
- 3 Hillandale Dr
- 2 Hillandale Dr
- 6 Dalewood Cir
- 1122 E Valley Dr
- 2603 N Hwy 341 Unit B
- 2603 N Highway 341 Unit A & B
- 2603 N Highway 341
- 2603 N Highway 341 Unit A
- 4 Hillandale Dr
- 341 Highway Hwy
- 5 Hillandale Dr