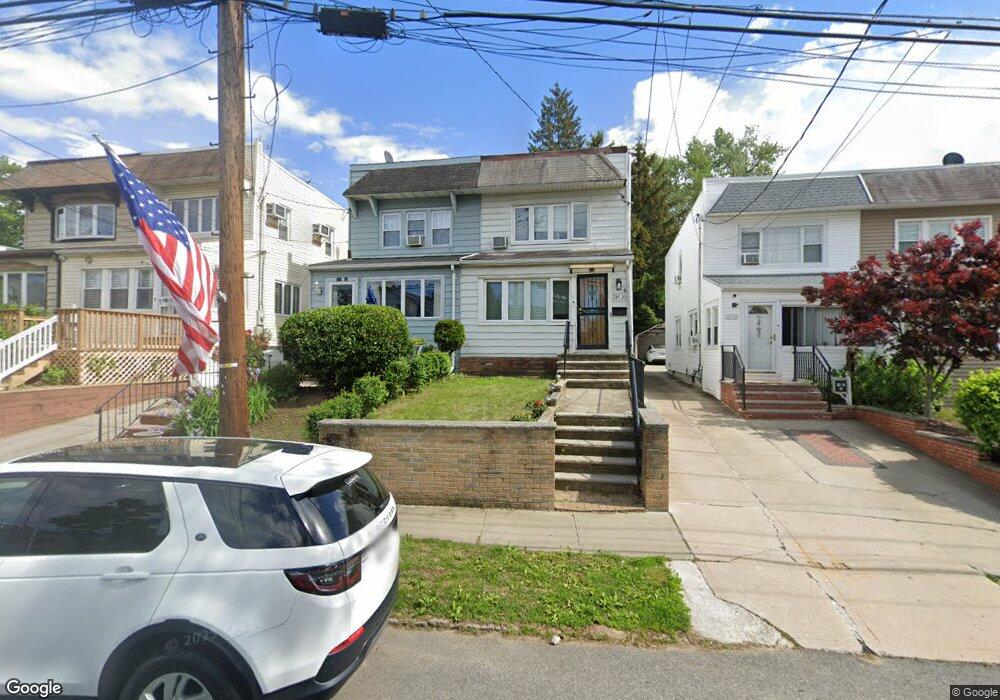
24722 43rd Ave Little Neck, NY 11363
Douglaston NeighborhoodEstimated Value: $703,526 - $902,000
Studio
--
Bath
1,065
Sq Ft
$751/Sq Ft
Est. Value
About This Home
This home is located at 24722 43rd Ave, Little Neck, NY 11363 and is currently estimated at $799,382, approximately $750 per square foot. 24722 43rd Ave is a home located in Queens County with nearby schools including P.S. 94 - David D. Porter, Louis Pasteur Middle School 67, and Benjamin N Cardozo High School.
Ownership History
Date
Name
Owned For
Owner Type
Purchase Details
Closed on
Dec 1, 2006
Sold by
Effros Erik and Effros Xanthe R
Bought by
Montalvo Jose and Montalvo Mary L
Current Estimated Value
Home Financials for this Owner
Home Financials are based on the most recent Mortgage that was taken out on this home.
Original Mortgage
$94,000
Outstanding Balance
$55,914
Interest Rate
6.31%
Estimated Equity
$743,468
Purchase Details
Closed on
Sep 28, 2000
Sold by
Doenges William C and Doengers Marie B
Bought by
Effros Erik and Effros Xanthe R
Home Financials for this Owner
Home Financials are based on the most recent Mortgage that was taken out on this home.
Original Mortgage
$217,600
Interest Rate
7.88%
Create a Home Valuation Report for This Property
The Home Valuation Report is an in-depth analysis detailing your home's value as well as a comparison with similar homes in the area
Home Values in the Area
Average Home Value in this Area
Purchase History
| Date | Buyer | Sale Price | Title Company |
|---|---|---|---|
| Montalvo Jose | $470,000 | -- | |
| Montalvo Jose | $470,000 | -- | |
| Effros Erik | $272,000 | First American Title Ins Co | |
| Effros Erik | $272,000 | First American Title Ins Co |
Source: Public Records
Mortgage History
| Date | Status | Borrower | Loan Amount |
|---|---|---|---|
| Open | Montalvo Jose | $94,000 | |
| Closed | Montalvo Jose | $94,000 | |
| Open | Montalvo Jose | $376,000 | |
| Closed | Montalvo Jose | $376,000 | |
| Previous Owner | Effros Erik | $217,600 |
Source: Public Records
Tax History
| Year | Tax Paid | Tax Assessment Tax Assessment Total Assessment is a certain percentage of the fair market value that is determined by local assessors to be the total taxable value of land and additions on the property. | Land | Improvement |
|---|---|---|---|---|
| 2025 | $4,814 | $25,796 | $7,122 | $18,674 |
| 2024 | $4,826 | $25,367 | $6,788 | $18,579 |
| 2023 | $4,554 | $24,074 | $6,077 | $17,997 |
| 2022 | $4,261 | $47,700 | $12,540 | $35,160 |
| 2021 | $4,228 | $41,820 | $12,540 | $29,280 |
| 2020 | $4,254 | $42,780 | $12,540 | $30,240 |
| 2019 | $4,129 | $42,840 | $12,540 | $30,300 |
| 2018 | $3,792 | $20,062 | $7,000 | $13,062 |
| 2017 | $3,571 | $18,987 | $7,241 | $11,746 |
| 2016 | $3,271 | $18,987 | $7,241 | $11,746 |
| 2015 | $1,941 | $17,914 | $8,133 | $9,781 |
| 2014 | $1,941 | $17,616 | $8,190 | $9,426 |
Source: Public Records
Map
Nearby Homes
- 43-29 249th St
- 41-33 248th St
- 41-29 248th St
- 44-06 Jessie Ct
- 41-16 249th St
- 4020 249th St
- 43 Avenue Unit 170
- 4001 Little Neck Pkwy Unit 31B
- 242-16 Pine St
- 40-01 Little Neck Pkwy Unit 16B
- 44-31 244th St
- 41-75 Morgan St
- 43-25 Douglaston Pkwy Unit 4J
- 43-25 Douglaston Pkwy Unit 1
- 43-25 Douglaston Pkwy Unit B
- 28 W 38th St Unit 2
- 4172 Glenwood St
- 24903 Rushmore Terrace
- 44-20 Douglaston Pkwy Unit 6B
- 46-11 245th St
- 24724 43rd Ave
- 24720 43rd Ave
- 247-20 43rd Ave
- 24724 43rd Ave Unit House
- 247-24 43rd Ave Unit House
- 247-24 43rd Ave
- 24718 43rd Ave
- 24726 43rd Ave
- 4312 248th St
- 24716 43rd Ave
- 43-12 248th St Unit 1A
- 4314 248th St
- 24714 43rd Ave
- 24714 43rd Ave
- 4316 248th St
- 24712 43rd Ave
- 247-12 43rd Ave
- 4318 248th St
- 24710 43rd Ave
- 4320 248th St
Your Personal Tour Guide
Ask me questions while you tour the home.