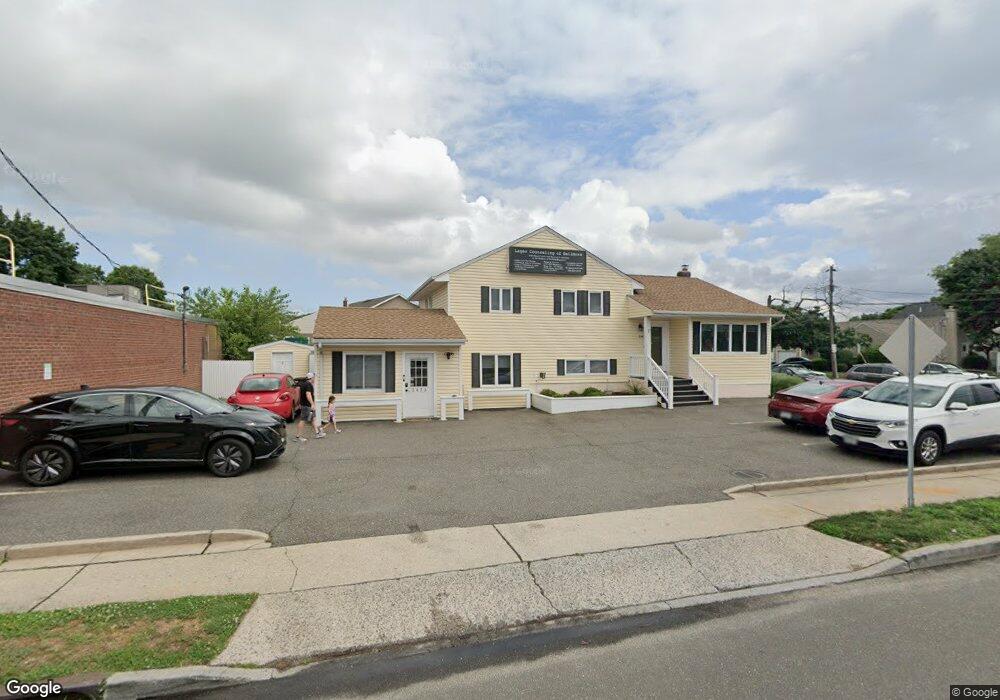
2473 Jerusalem Ave North Bellmore, NY 11710
Estimated Value: $954,943
--
Bed
--
Bath
5,012
Sq Ft
$191/Sq Ft
Est. Value
About This Home
This home is located at 2473 Jerusalem Ave, North Bellmore, NY 11710 and is currently estimated at $954,943, approximately $190 per square foot. 2473 Jerusalem Ave is a home located in Nassau County with nearby schools including Grand Avenue Middle School, Wellington C Mepham High School, and Sacred Heart School.
Ownership History
Date
Name
Owned For
Owner Type
Purchase Details
Closed on
Jan 24, 2024
Sold by
2473 Jerusalem Ave Llc
Bought by
2473 Lcs Corp
Current Estimated Value
Home Financials for this Owner
Home Financials are based on the most recent Mortgage that was taken out on this home.
Original Mortgage
$783,000
Interest Rate
6.6%
Mortgage Type
Stand Alone First
Purchase Details
Closed on
Sep 18, 2014
Sold by
Dallow Richard
Bought by
2473 Jerusalem Ave Llc
Purchase Details
Closed on
Feb 22, 2000
Sold by
Dallow Theodore and Dallow Phyllis F
Bought by
Dallow Richard
Purchase Details
Closed on
Jun 29, 1998
Sold by
Thielke Sue Ayn
Bought by
Dallow Phyllis F and Dallow Theodore
Create a Home Valuation Report for This Property
The Home Valuation Report is an in-depth analysis detailing your home's value as well as a comparison with similar homes in the area
Home Values in the Area
Average Home Value in this Area
Purchase History
| Date | Buyer | Sale Price | Title Company |
|---|---|---|---|
| 2473 Lcs Corp | $825,000 | Chicago Title Insurance Co | |
| 2473 Lcs Corp | $825,000 | Chicago Title Insurance Co | |
| 2473 Jerusalem Ave Llc | -- | Fidelity National Title | |
| 2473 Jerusalem Ave Llc | -- | Fidelity National Title | |
| 2473 Jerusalem Ave Llc | -- | Fidelity National Title | |
| Dallow Richard | -- | Commonwealth Land Title Ins | |
| Dallow Richard | -- | Commonwealth Land Title Ins | |
| Dallow Phyllis F | $390,000 | -- | |
| Dallow Phyllis F | $390,000 | -- |
Source: Public Records
Mortgage History
| Date | Status | Borrower | Loan Amount |
|---|---|---|---|
| Closed | 2473 Lcs Corp | $783,000 |
Source: Public Records
Tax History Compared to Growth
Tax History
| Year | Tax Paid | Tax Assessment Tax Assessment Total Assessment is a certain percentage of the fair market value that is determined by local assessors to be the total taxable value of land and additions on the property. | Land | Improvement |
|---|---|---|---|---|
| 2025 | $17,141 | $2,880 | $1,614 | $1,266 |
| 2024 | $7,739 | $3,156 | $1,769 | $1,387 |
| 2023 | $17,525 | $3,156 | $1,769 | $1,387 |
| 2022 | $17,525 | $3,156 | $1,769 | $1,387 |
| 2021 | $21,708 | $3,259 | $1,769 | $1,490 |
| 2020 | $17,154 | $2,448 | $2,447 | $1 |
| 2019 | $17,524 | $2,448 | $2,381 | $67 |
| 2018 | $16,906 | $2,448 | $0 | $0 |
| 2017 | $8,075 | $2,663 | $1,972 | $691 |
| 2016 | $17,925 | $3,497 | $2,590 | $907 |
| 2015 | $9,914 | $3,497 | $2,590 | $907 |
| 2014 | $9,914 | $3,497 | $2,590 | $907 |
| 2013 | $9,287 | $3,497 | $2,590 | $907 |
Source: Public Records
Map
Nearby Homes
- 2425 Sycamore Ln
- 2531 Jerusalem Ave Unit 2G
- 2418 Knob Hill Dr
- 2166 Isabelle Ct
- 1399 Bellmore Ave
- 1346 Bellmore Ave
- 1078 Barbara Ct
- 1064 Barbara Ct
- 2360 Hamilton Rd
- 2475 Marshall Ave
- 980 Siems Ct
- 975 Little Neck Ave
- 1582 Little Neck Ave
- 1253 Raymond Rd
- 2327 Cleveland St
- 2453 Hull Ave
- 1427 Bellmore Rd
- 526 Park Ave
- 1618 Paula Ct
- 1448 Dewey Ave
- 1188 Albert Rd
- 1180 Albert Rd
- 2479 Jerusalem Ave
- 1189 Albert Rd
- 2453 Jerusalem Ave
- 1183 Albert Rd
- 1174 Albert Rd
- 1177 Albert Rd
- 2444 Foster Ct
- 2484 Jerusalem Ave
- 1168 Albert Rd
- 1190 Little Neck Ave
- 1182 Little Neck Ave
- 1198 Little Neck Rd
- 1174 Little Neck Ave
- 2442 Foster Ct
- 1171 Albert Rd
- 2492 Jerusalem Ave
- 1166 Little Neck Ave
- 2499 Jerusalem Ave