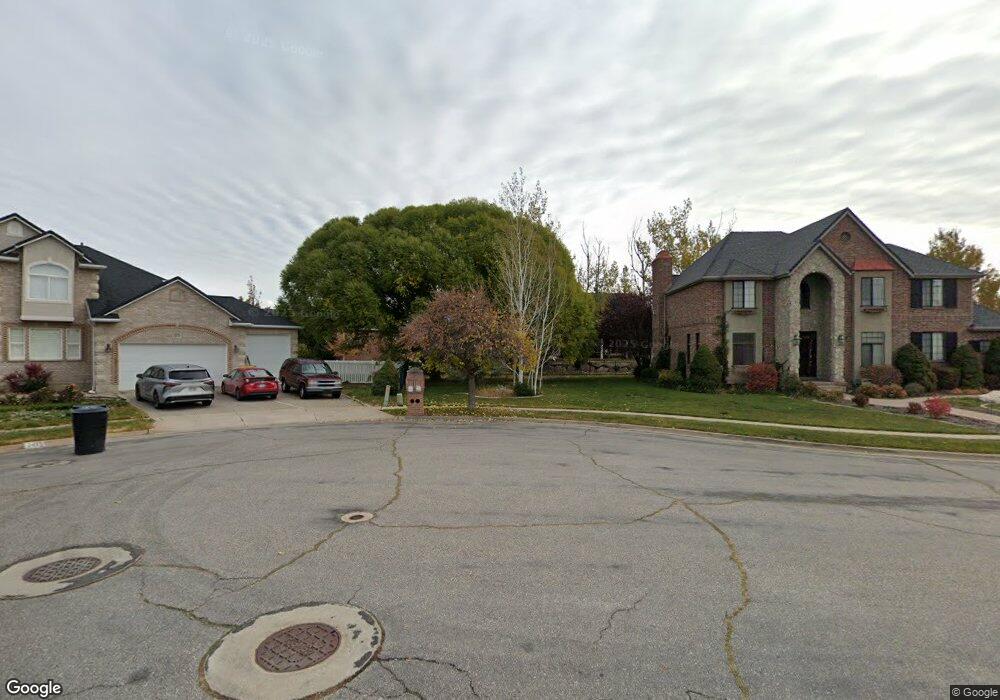
2473 S 1100 W Syracuse, UT 84075
Estimated Value: $719,000 - $980,000
7
Beds
4
Baths
3,506
Sq Ft
$252/Sq Ft
Est. Value
About This Home
This home is located at 2473 S 1100 W, Syracuse, UT 84075 and is currently estimated at $884,318, approximately $252 per square foot. 2473 S 1100 W is a home located in Davis County with nearby schools including Bluff Ridge Elementary, Legacy Junior High School, and Clearfield High School.
Ownership History
Date
Name
Owned For
Owner Type
Purchase Details
Closed on
Apr 23, 2021
Sold by
Strong Stacy and Stacy Strong Living Trust
Bought by
Snyder Karen
Current Estimated Value
Purchase Details
Closed on
Apr 13, 2016
Sold by
Strong Stacy
Bought by
Strong Stacy and Strong Living Trust
Create a Home Valuation Report for This Property
The Home Valuation Report is an in-depth analysis detailing your home's value as well as a comparison with similar homes in the area
Home Values in the Area
Average Home Value in this Area
Purchase History
| Date | Buyer | Sale Price | Title Company |
|---|---|---|---|
| Snyder Karen | -- | Mountain View Title | |
| Strong Stacy | -- | -- | |
| Strong Stacy | -- | -- |
Source: Public Records
Tax History Compared to Growth
Tax History
| Year | Tax Paid | Tax Assessment Tax Assessment Total Assessment is a certain percentage of the fair market value that is determined by local assessors to be the total taxable value of land and additions on the property. | Land | Improvement |
|---|---|---|---|---|
| 2025 | $4,595 | $443,300 | $126,078 | $317,222 |
| 2024 | $4,739 | $460,350 | $111,740 | $348,610 |
| 2023 | $4,356 | $771,000 | $155,254 | $615,746 |
| 2022 | $4,149 | $402,600 | $88,319 | $314,281 |
| 2021 | $3,529 | $530,000 | $131,384 | $398,616 |
| 2020 | $3,308 | $481,000 | $110,665 | $370,335 |
| 2019 | $3,239 | $465,000 | $112,816 | $352,184 |
| 2018 | $3,081 | $439,000 | $106,437 | $332,563 |
| 2016 | $2,912 | $217,635 | $40,683 | $176,952 |
| 2015 | $3,109 | $221,265 | $40,683 | $180,582 |
| 2014 | $3,198 | $231,927 | $40,683 | $191,244 |
| 2013 | -- | $204,471 | $41,678 | $162,793 |
Source: Public Records
Map
Nearby Homes