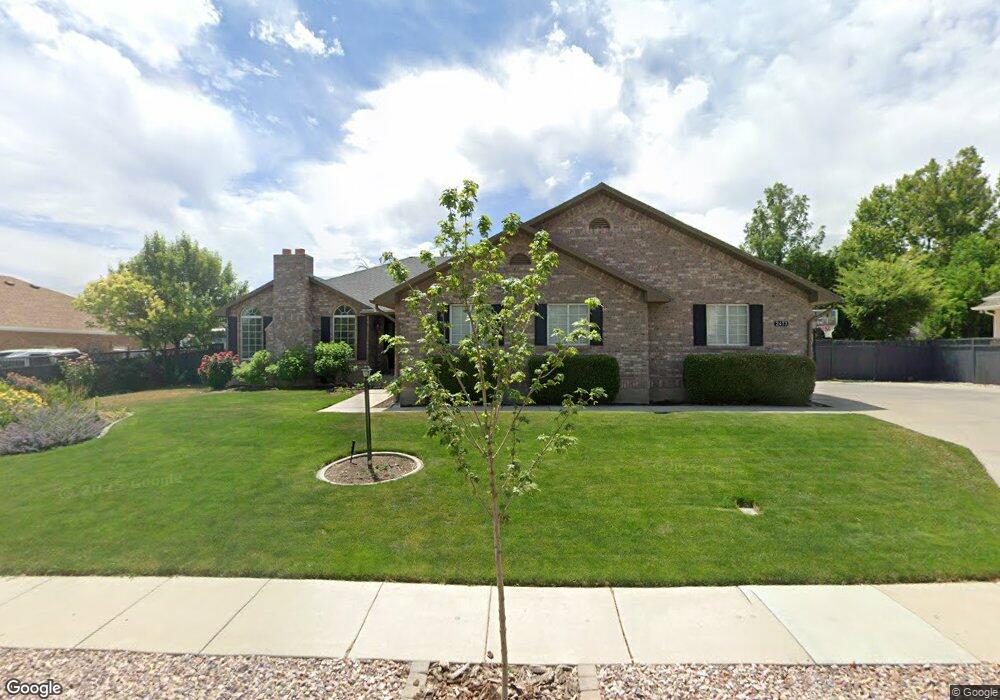
2473 W Winding Way South Jordan, UT 84095
Estimated Value: $866,000 - $937,000
6
Beds
3
Baths
4,964
Sq Ft
$181/Sq Ft
Est. Value
About This Home
This home is located at 2473 W Winding Way, South Jordan, UT 84095 and is currently estimated at $898,118, approximately $180 per square foot. 2473 W Winding Way is a home located in Salt Lake County with nearby schools including Jordan Ridge School, South Jordan Middle School, and Hawthorn Academy.
Ownership History
Date
Name
Owned For
Owner Type
Purchase Details
Closed on
Oct 20, 2013
Sold by
Last Mile Properties Llc
Bought by
Carlson Chad and Carlson Denae
Current Estimated Value
Purchase Details
Closed on
Feb 14, 2013
Sold by
33 Holdings Llc
Bought by
Last Mile Properties Llc
Purchase Details
Closed on
Feb 11, 2013
Sold by
Edward Jones Trust Co
Bought by
33 Holdings Llc
Purchase Details
Closed on
Mar 25, 1998
Sold by
Myrtle C Lund Trust and Anderson Richard
Bought by
Anderson Richard Dan and Smith Darlene
Purchase Details
Closed on
Feb 4, 1998
Sold by
Anderson Richard D and Anderson Ivia M
Bought by
Anderson Richard
Purchase Details
Closed on
Jun 7, 1996
Sold by
First Interstate Bank Of Utah N A
Bought by
Anderson Richard and Smith Darlene
Create a Home Valuation Report for This Property
The Home Valuation Report is an in-depth analysis detailing your home's value as well as a comparison with similar homes in the area
Home Values in the Area
Average Home Value in this Area
Purchase History
| Date | Buyer | Sale Price | Title Company |
|---|---|---|---|
| Carlson Chad | -- | Title Guarantee | |
| Last Mile Properties Llc | -- | Title Guarantee S Jordan | |
| 33 Holdings Llc | -- | Magellan Title | |
| Anderson Richard Dan | -- | -- | |
| Anderson Richard | -- | -- | |
| Anderson Richard | -- | -- |
Source: Public Records
Tax History Compared to Growth
Tax History
| Year | Tax Paid | Tax Assessment Tax Assessment Total Assessment is a certain percentage of the fair market value that is determined by local assessors to be the total taxable value of land and additions on the property. | Land | Improvement |
|---|---|---|---|---|
| 2025 | $4,118 | $818,900 | $309,100 | $509,800 |
| 2024 | $4,118 | $781,900 | $289,000 | $492,900 |
| 2023 | $4,187 | $750,100 | $283,300 | $466,800 |
| 2022 | $4,389 | $770,700 | $277,800 | $492,900 |
| 2021 | $3,689 | $594,300 | $227,800 | $366,500 |
| 2020 | $3,473 | $524,500 | $213,300 | $311,200 |
| 2019 | $3,226 | $478,800 | $213,300 | $265,500 |
| 2018 | $3,025 | $446,800 | $138,200 | $308,600 |
| 2017 | $2,896 | $419,200 | $138,200 | $281,000 |
| 2016 | $2,822 | $387,000 | $138,200 | $248,800 |
| 2015 | $2,594 | $345,900 | $151,400 | $194,500 |
| 2014 | $2,419 | $317,000 | $140,900 | $176,100 |
Source: Public Records
Map
Nearby Homes
- 2551 W Winding Way
- 2439 Bridle Oak Dr
- 2246 Country Bend Dr Unit 25
- 2375 Bonanza Way
- 1891 Orchard View Cir
- 2554 Cherry Grove Way
- 2343 Temple View Cir
- 10320 S 2700 W
- 1788 W Ikaros Ln
- 10366 S 2200 W
- 9496 S 1930 W
- 1767 W Ikaros Ln
- 1967 W 9350 S
- 2097 Jordan Villa Dr
- 9414 S 1980 W
- 10177 Statesman Place
- 1741 W Nikos Ln
- 1558 W Banner Dr Unit 805
- 1574 W Banner Dr Unit 743
- 1556 W Banner Dr Unit 806
- 2473 Winding Way
- 2485 W Winding Way
- 2485 Winding Way
- 2457 Winding Way
- 2474 Landau Ln
- 2486 Landau Ln
- 2472 Winding Way
- 9877 Winding Way
- 2486 Winding Way
- 2507 Winding Way
- 2426 Jordan Haven Ct
- 2506 Landau Ln
- 9863 Winding Way
- 9863 S Winding Way
- 9931 Landau Ln
- 2508 W Winding Way
- 2508 Winding Way
- 2433 Jordan Haven Ct
- 2433 W Jordan Haven Ct
- 2463 Country Bend Dr