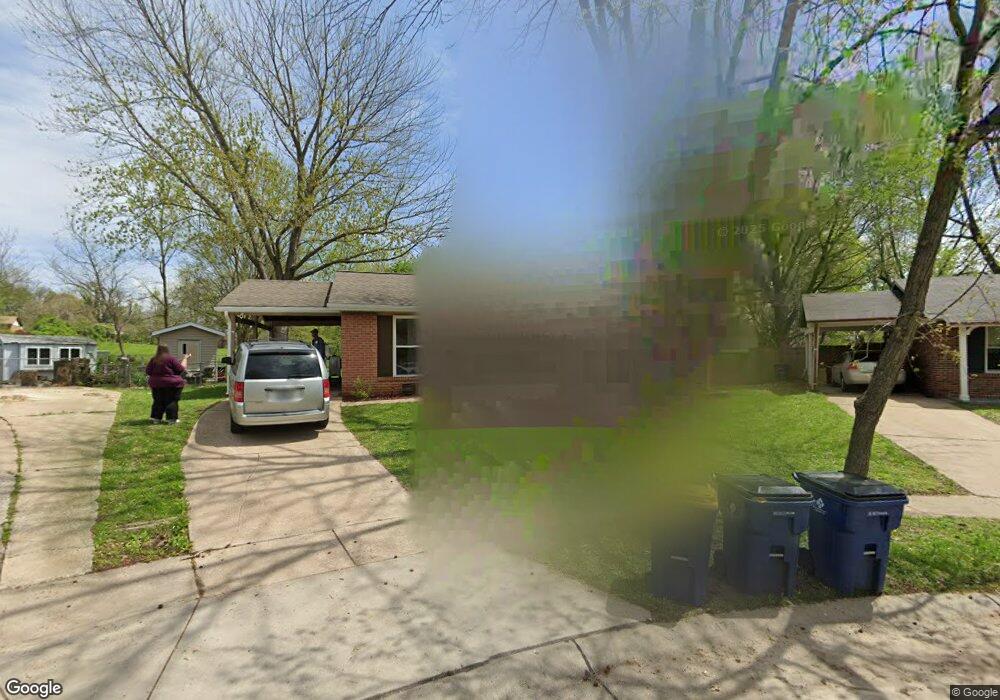
2474 Stoney End Ct Florissant, MO 63031
Estimated Value: $182,000 - $197,000
3
Beds
2
Baths
1,189
Sq Ft
$161/Sq Ft
Est. Value
About This Home
This home is located at 2474 Stoney End Ct, Florissant, MO 63031 and is currently estimated at $191,657, approximately $161 per square foot. 2474 Stoney End Ct is a home located in St. Louis County with nearby schools including Walker Elementary School, Northwest Middle School, and Hazelwood West High School.
Ownership History
Date
Name
Owned For
Owner Type
Purchase Details
Closed on
Jul 11, 2025
Sold by
Vance Cherisa S
Bought by
Vance Nicholas J
Current Estimated Value
Purchase Details
Closed on
Apr 26, 2013
Sold by
Advantage Properties Llc
Bought by
Vance Nicholas
Home Financials for this Owner
Home Financials are based on the most recent Mortgage that was taken out on this home.
Original Mortgage
$78,452
Interest Rate
4.4%
Mortgage Type
FHA
Purchase Details
Closed on
Jan 17, 2012
Sold by
Odriscoll Patrick J and Odriscoll Teresa M
Bought by
Advantage Properties Llc
Purchase Details
Closed on
Dec 3, 2009
Sold by
Lewis Mitchell Company
Bought by
Odriscoll Patrick J and Odriscoll Teresa M
Purchase Details
Closed on
Apr 23, 2008
Sold by
Odriscoll Patrick J and Odriscoll Teresa M
Bought by
Lewis Mitchell Company
Create a Home Valuation Report for This Property
The Home Valuation Report is an in-depth analysis detailing your home's value as well as a comparison with similar homes in the area
Home Values in the Area
Average Home Value in this Area
Purchase History
| Date | Buyer | Sale Price | Title Company |
|---|---|---|---|
| Vance Nicholas J | -- | None Listed On Document | |
| Vance Nicholas | $79,900 | Investors Title Co Clayton | |
| Advantage Properties Llc | $15,800 | None Available | |
| Odriscoll Patrick J | -- | None Available | |
| Lewis Mitchell Company | -- | None Available |
Source: Public Records
Mortgage History
| Date | Status | Borrower | Loan Amount |
|---|---|---|---|
| Previous Owner | Vance Nicholas | $78,452 |
Source: Public Records
Tax History Compared to Growth
Tax History
| Year | Tax Paid | Tax Assessment Tax Assessment Total Assessment is a certain percentage of the fair market value that is determined by local assessors to be the total taxable value of land and additions on the property. | Land | Improvement |
|---|---|---|---|---|
| 2025 | $2,565 | $30,020 | $5,620 | $24,400 |
| 2024 | $2,565 | $29,340 | $3,230 | $26,110 |
| 2023 | $2,565 | $29,340 | $3,230 | $26,110 |
| 2022 | $2,271 | $23,150 | $3,710 | $19,440 |
| 2021 | $2,238 | $23,150 | $3,710 | $19,440 |
| 2020 | $2,006 | $19,290 | $3,710 | $15,580 |
| 2019 | $1,976 | $19,290 | $3,710 | $15,580 |
| 2018 | $1,882 | $16,890 | $2,470 | $14,420 |
| 2017 | $1,880 | $16,890 | $2,470 | $14,420 |
| 2016 | $1,652 | $14,610 | $2,850 | $11,760 |
| 2015 | $1,617 | $14,610 | $2,850 | $11,760 |
| 2014 | $1,689 | $15,740 | $3,710 | $12,030 |
Source: Public Records
Map
Nearby Homes
- 2618 Freemantle Dr
- 2106 Kingsford Dr
- 2042 Farflung Dr
- 2314 Stoney End Ct
- 2235 Central Parkway Dr
- 2347 Farflung Dr
- 2112 Millvalley Dr
- 2437 Periwinkle Ct
- 1834 Night Dr
- 2216 Foggy Bottom Dr
- 1885 High Sun Dr
- 1907 High Sun Dr
- 1920 High Sun Dr
- 1863 High Sun Dr Unit 51863
- 2112 New Sun Dr
- 1831 New Sun Ct Unit 5
- 1830 New Sun Ct
- 2048 New Sun Dr
- 1920 Shackelford Rd
- 2515 Flamingo Dr
- 2464 Stoney End Ct
- 2484 Stoney End Ct
- 2454 Stoney End Ct
- 2485 Stoney End Ct
- 2475 Stoney End Ct
- 2573 Auburnhill Ct
- 2583 Auburnhill Ct
- 2455 Stoney End Ct
- 2434 Stoney End Ct
- 2184 White Ash Ct
- 2194 White Ash Ct
- 2445 Stoney End Ct
- 2563 Auburnhill Ct
- 2533 Auburnhill Ct
- 2593 Auburnhill Ct
- 2424 Stoney End Ct
- 2435 Stoney End Ct
- 2204 White Ash Ct
- 2608 Freemantle Dr