24748 Buck Creek San Antonio, TX 78255
Estimated Value: $438,105 - $495,000
4
Beds
4
Baths
2,733
Sq Ft
$172/Sq Ft
Est. Value
About This Home
This home is located at 24748 Buck Creek, San Antonio, TX 78255 and is currently estimated at $470,276, approximately $172 per square foot. 24748 Buck Creek is a home located in Bexar County with nearby schools including Aue Elementary School, Rawlinson Middle School, and Clark High School.
Ownership History
Date
Name
Owned For
Owner Type
Purchase Details
Closed on
Oct 30, 2017
Sold by
Walther Philip James
Bought by
Walther Philip James and Walther Deborah A
Current Estimated Value
Home Financials for this Owner
Home Financials are based on the most recent Mortgage that was taken out on this home.
Original Mortgage
$175,000
Outstanding Balance
$96,101
Interest Rate
3.83%
Mortgage Type
New Conventional
Estimated Equity
$374,175
Purchase Details
Closed on
May 29, 2013
Sold by
Weekley Homes Llc
Bought by
Walther Philip James
Home Financials for this Owner
Home Financials are based on the most recent Mortgage that was taken out on this home.
Original Mortgage
$276,400
Outstanding Balance
$196,089
Interest Rate
3.43%
Mortgage Type
New Conventional
Estimated Equity
$274,187
Create a Home Valuation Report for This Property
The Home Valuation Report is an in-depth analysis detailing your home's value as well as a comparison with similar homes in the area
Home Values in the Area
Average Home Value in this Area
Purchase History
| Date | Buyer | Sale Price | Title Company |
|---|---|---|---|
| Walther Philip James | -- | None Available | |
| Walther Philip James | -- | Ptc |
Source: Public Records
Mortgage History
| Date | Status | Borrower | Loan Amount |
|---|---|---|---|
| Open | Walther Philip James | $175,000 | |
| Open | Walther Philip James | $276,400 |
Source: Public Records
Tax History Compared to Growth
Tax History
| Year | Tax Paid | Tax Assessment Tax Assessment Total Assessment is a certain percentage of the fair market value that is determined by local assessors to be the total taxable value of land and additions on the property. | Land | Improvement |
|---|---|---|---|---|
| 2025 | $3,634 | $473,564 | $77,280 | $413,540 |
| 2024 | $3,634 | $430,513 | $77,280 | $386,620 |
| 2023 | $3,634 | $391,375 | $77,280 | $383,460 |
| 2022 | $7,064 | $355,795 | $59,960 | $363,950 |
| 2021 | $6,663 | $323,450 | $57,040 | $266,410 |
| 2020 | $6,443 | $306,150 | $57,040 | $249,110 |
| 2019 | $6,622 | $304,210 | $57,040 | $247,170 |
| 2018 | $6,131 | $281,620 | $57,040 | $224,580 |
| 2017 | $6,201 | $283,940 | $57,040 | $226,900 |
| 2016 | $6,113 | $279,890 | $57,040 | $222,850 |
| 2015 | $5,846 | $284,400 | $57,040 | $227,360 |
| 2014 | $5,846 | $273,260 | $0 | $0 |
Source: Public Records
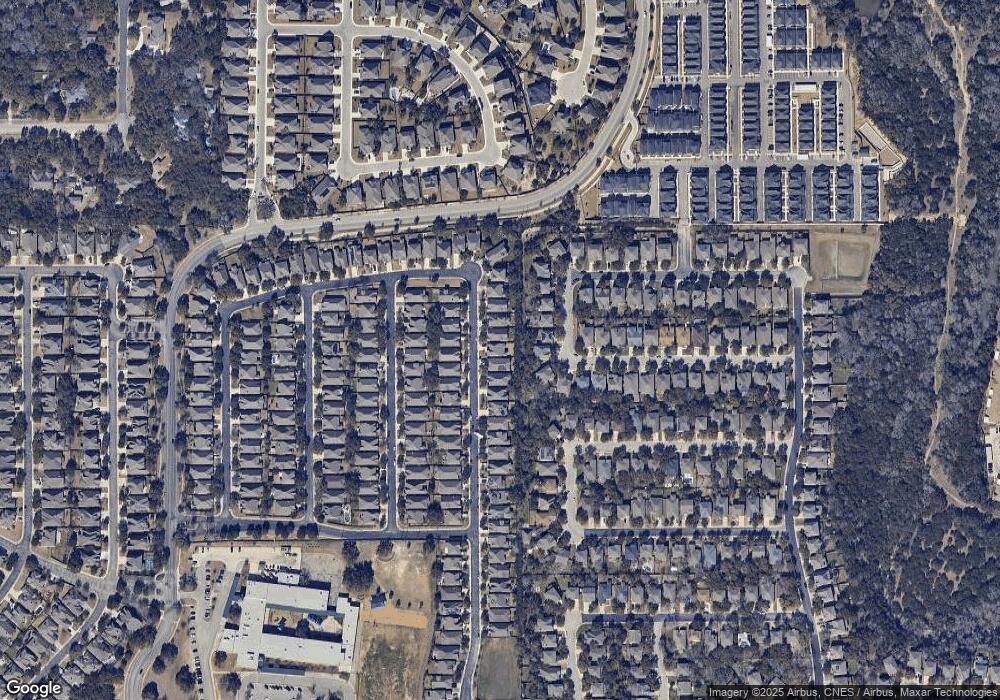
Map
Nearby Homes
- 25151 Buttermilk Ln
- 25127 Royal Land
- 8312 Merchants Lodge
- 8111 Jalane Park
- 8110 Cooper Corral Cir
- 25410 Tidal Creek
- 8226 Two Winds
- 24915 White Creek
- 8219 Wayside Creek
- 24831 Cloudy Creek
- 8503 Silent Creek
- 8318 Cactus Wren Ln
- 24442 Buck Creek
- 24710 Cloudy Creek
- 14728 Childress Falls
- 24423 Elise Falls
- 25007 Seal Cove
- 7811 Midnight Stage
- 25764 Velvet Creek
- 24406 Treaty Creek
- 24752 Buck Creek
- 24744 Buck Creek
- 24756 Buck Creek
- 24740 Buck Creek
- 24736 Buck Creek
- 24760 Buck Creek
- 24747 Buck Creek
- 24751 Buck Creek
- 25111 Royal Land
- 25103 Royal Land
- 24743 Buck Creek
- 24755 Buck Creek
- 25115 Royal Land
- 24732 Buck Creek
- 24764 Buck Creek
- 24739 Buck Creek
- 24759 Buck Creek
- 25119 Royal Land
- 24735 Buck Creek
- 24763 Buck Creek