Estimated Value: $369,000 - $426,000
3
Beds
2
Baths
1,900
Sq Ft
$209/Sq Ft
Est. Value
About This Home
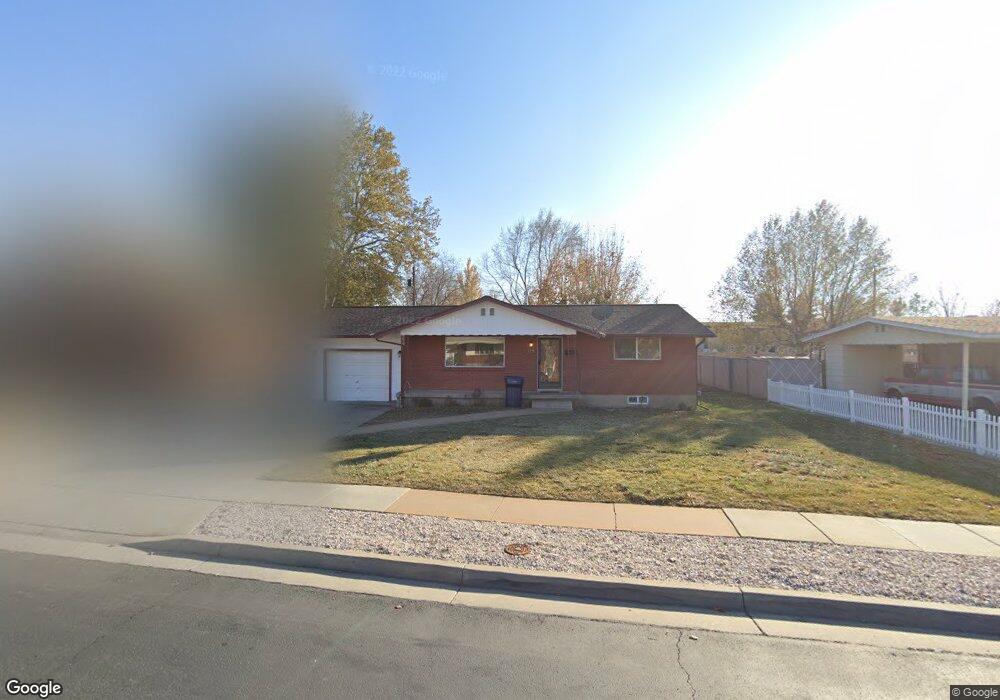
This home is located at 2475 W 4750 S, Roy, UT 84067 and is currently estimated at $396,485, approximately $208 per square foot. 2475 W 4750 S is a home located in Weber County with nearby schools including Valley View School, Sand Ridge Junior High School, and Roy High School.
Ownership History
Date
Name
Owned For
Owner Type
Purchase Details
Closed on
Apr 11, 2023
Sold by
Jerry Lamar Hartey and Jerry Carol Ionia
Bought by
Scott Angelita Amando and Scott Amando Bernadita
Current Estimated Value
Home Financials for this Owner
Home Financials are based on the most recent Mortgage that was taken out on this home.
Original Mortgage
$330,000
Outstanding Balance
$320,912
Interest Rate
6.65%
Mortgage Type
New Conventional
Estimated Equity
$75,573
Purchase Details
Closed on
Sep 25, 2020
Sold by
Austin Brianna and Austin James
Bought by
Hoffman Dean D and Hoffman Judith S
Purchase Details
Closed on
Jan 4, 2014
Sold by
Hartey Jerry L and Hartey Carol I
Bought by
Hartey Jerry Lamar and Mcent Carol Ionia
Purchase Details
Closed on
Jan 15, 1999
Sold by
Hartey Jerry L and Hartey Jerry J
Bought by
Hartey Jerry L and Hartey Carol I
Create a Home Valuation Report for This Property
The Home Valuation Report is an in-depth analysis detailing your home's value as well as a comparison with similar homes in the area
Home Values in the Area
Average Home Value in this Area
Purchase History
| Date | Buyer | Sale Price | Title Company |
|---|---|---|---|
| Scott Angelita Amando | -- | None Listed On Document | |
| Hoffman Dean D | -- | Us Title Insurance Agency | |
| Hartey Jerry Lamar | -- | None Available | |
| Hartey Jerry L | -- | Associated Title |
Source: Public Records
Mortgage History
| Date | Status | Borrower | Loan Amount |
|---|---|---|---|
| Open | Scott Angelita Amando | $330,000 |
Source: Public Records
Tax History Compared to Growth
Tax History
| Year | Tax Paid | Tax Assessment Tax Assessment Total Assessment is a certain percentage of the fair market value that is determined by local assessors to be the total taxable value of land and additions on the property. | Land | Improvement |
|---|---|---|---|---|
| 2025 | $2,416 | $378,233 | $122,630 | $255,603 |
| 2024 | $2,359 | $204,599 | $67,447 | $137,152 |
| 2023 | $2,206 | $190,850 | $64,239 | $126,611 |
| 2022 | $2,458 | $221,650 | $55,729 | $165,921 |
| 2021 | $1,902 | $279,000 | $71,325 | $207,675 |
| 2020 | $1,735 | $233,000 | $71,325 | $161,675 |
| 2019 | $1,741 | $221,000 | $40,995 | $180,005 |
| 2018 | $1,682 | $201,000 | $36,920 | $164,080 |
| 2017 | $1,498 | $166,000 | $36,920 | $129,080 |
| 2016 | $1,440 | $85,744 | $19,302 | $66,442 |
| 2015 | $1,276 | $76,963 | $19,302 | $57,661 |
| 2014 | $1,152 | $67,563 | $16,433 | $51,130 |
Source: Public Records
Map
Nearby Homes