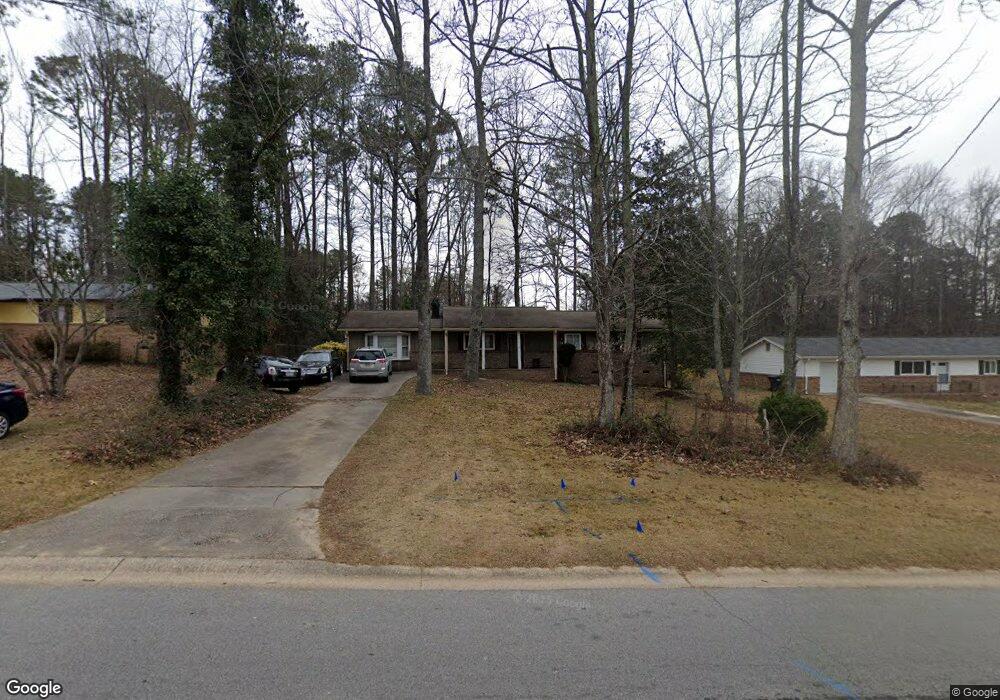
2477 Chestnut Log Loop Unit 7 Lithia Springs, GA 30122
Lithia Springs NeighborhoodEstimated Value: $218,000 - $255,000
3
Beds
2
Baths
1,682
Sq Ft
$140/Sq Ft
Est. Value
About This Home
This home is located at 2477 Chestnut Log Loop Unit 7, Lithia Springs, GA 30122 and is currently estimated at $235,841, approximately $140 per square foot. 2477 Chestnut Log Loop Unit 7 is a home located in Douglas County with nearby schools including Sweetwater Elementary School, Factory Shoals Middle School, and Lithia Springs Comprehensive High School.
Ownership History
Date
Name
Owned For
Owner Type
Purchase Details
Closed on
Jul 31, 2001
Sold by
Luna Stanley R and Luna Betty J
Bought by
Cunningham Lakeisha
Current Estimated Value
Home Financials for this Owner
Home Financials are based on the most recent Mortgage that was taken out on this home.
Original Mortgage
$90,801
Interest Rate
6.87%
Mortgage Type
FHA
Purchase Details
Closed on
Aug 16, 1995
Sold by
Schouest Michael Kim
Bought by
Pittman Charles
Purchase Details
Closed on
Jan 27, 1995
Sold by
Va
Bought by
Schouest Michael Kim
Home Financials for this Owner
Home Financials are based on the most recent Mortgage that was taken out on this home.
Original Mortgage
$45,650
Interest Rate
7.5%
Mortgage Type
VA
Purchase Details
Closed on
Feb 1, 1994
Sold by
Leader F B
Bought by
Va
Create a Home Valuation Report for This Property
The Home Valuation Report is an in-depth analysis detailing your home's value as well as a comparison with similar homes in the area
Home Values in the Area
Average Home Value in this Area
Purchase History
| Date | Buyer | Sale Price | Title Company |
|---|---|---|---|
| Cunningham Lakeisha | $91,600 | -- | |
| Pittman Charles | $63,000 | -- | |
| Schouest Michael Kim | $45,650 | -- | |
| Va | -- | -- | |
| Leader F B | $46,500 | -- |
Source: Public Records
Mortgage History
| Date | Status | Borrower | Loan Amount |
|---|---|---|---|
| Previous Owner | Cunningham Lakeisha | $90,801 | |
| Previous Owner | Schouest Michael Kim | $45,650 | |
| Closed | Pittman Charles | $0 |
Source: Public Records
Tax History Compared to Growth
Tax History
| Year | Tax Paid | Tax Assessment Tax Assessment Total Assessment is a certain percentage of the fair market value that is determined by local assessors to be the total taxable value of land and additions on the property. | Land | Improvement |
|---|---|---|---|---|
| 2024 | $2,020 | $86,760 | $18,000 | $68,760 |
| 2023 | $2,020 | $86,760 | $18,000 | $68,760 |
| 2022 | $1,579 | $61,360 | $18,000 | $43,360 |
| 2021 | $1,249 | $44,760 | $12,000 | $32,760 |
| 2020 | $1,273 | $44,760 | $12,000 | $32,760 |
| 2019 | $935 | $33,440 | $9,240 | $24,200 |
| 2018 | $787 | $28,520 | $8,040 | $20,480 |
| 2017 | $717 | $25,872 | $8,040 | $17,832 |
| 2016 | $867 | $30,200 | $9,600 | $20,600 |
| 2015 | $749 | $26,076 | $8,520 | $17,556 |
| 2014 | $737 | $25,284 | $8,640 | $16,644 |
| 2013 | -- | $28,000 | $9,600 | $18,400 |
Source: Public Records
Map
Nearby Homes
- 2499 Chestnut Log Loop
- 1940 Lee
- 3570 Briar Dr
- 2322 Chestnut Log Loop
- 3652 Sweetbriar Cir
- 3646 Briar Dr
- 3686 Sweetbriar Cir
- 2275 Chestnut Log Loop
- LOT 27 Chestnut Ln
- 1815 Lee Rd
- 8684 Hickory Ln
- 3790 Sweetbriar Cir
- HAYDEN Plan at Fairhaven
- GREEN Plan at Fairhaven
- CALI Plan at Fairhaven
- ELLE Plan at Fairhaven
- PENWELL Plan at Fairhaven
- 1774 Trail Creek Dr
- 2436 Falls River Dr
- 2182 Ann Ln
- 2467 Chestnut Log Loop
- 2487 Chestnut Log Loop
- 2000 Lee Rd
- 2457 Chestnut Log Loop
- 2470 Chestnut Log Loop
- 2480 Chestnut Log Loop
- 2490 Chestnut Log Loop
- 2447 Chestnut Log Loop
- 2041 Chestnut Start Dr
- 2500 Chestnut Log Loop
- 2051 Chestnut Start Dr
- 2062 Chestnut Start Dr
- 000 Lee Rd
- 00 Lee Rd
- 8405 Lee Rd
- 2514 Chestnut Log Loop
- 2427 Chestnut Log Loop
- 2005 Lee Rd
- 2061 Chestnut Start Dr
- 8421 Lee Rd