NOT LISTED FOR SALE
5 Acres
-- Price per Acre
217,800 Sq Ft Lot

Last Sold December 20, 2021

Last sale price $2,300,000

474 Days on Market

Highlights

  • Pier or Dock
  • Property Fronts a Bay or Harbor
  • No HOA
  • Boat Ramp
  • 5 Acre Lot
  • Open Lot

About This Lot

As of December 2021

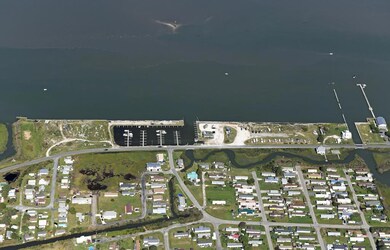
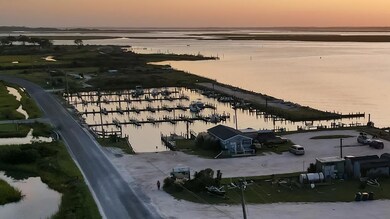
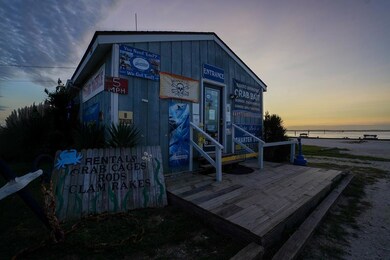
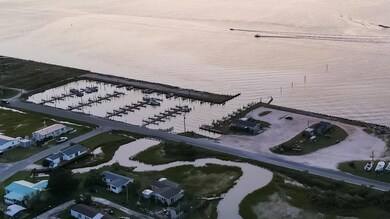
NEW BEGINNINGS for the END OF AN ERA! Captain Bob's Marina, an iconic Chincoteague destination for many decades, is being offered for sale.This once popular mid-Atlantic destination for avid fishermen features 5+/- AC of waterfront on Chincoteague Bay zoned C-4 Resort Commercial (see Docs) & inclds improvements-bait&tackle bldg, baths & AG fueltanks (Business not4sale). The marina is in operation with 97 boat slips; originally there were 114 slips. Chincoteague Island has become the "place to be" for vacationers that come from far & wide. Our "Best Little Beach Town" ranking draws so many visitors each year & there is a heavy need for marina services. If you're looking for residential/fine dining/marina opportunities, this is it. Opinion for 20+BR Septic **The north most 200' not included.

Last Listed By

Meghan Oliver Clarkson

LONG & FOSTER CHINCOTEAGUE License #0225085807 Listed on: 08/29/2020

LONG & FOSTER CHINCOTEAGUE

Property Details

Property Type

  • Land

Est. Annual Taxes

  • $4,766

Year Built

  • 1970

Lot Details

  • 5 Acre Lot
  • Property Fronts a Bay or Harbor
  • Property fronts a highway
  • Open Lot
  • Zoning described as Other-See Remarks

Parking

  • Driveway
  • Open Parking

Schools

  • Chincoteague Combined Elementary And Middle School
  • Chincoteague High School

Utilities

  • Septic Tank
  • Phone Available
  • Cable TV Available

Listing and Financial Details

  • Tax Lot 50+
  • $783,900 per year additional tax assessments

Community Details

Overview

  • No Home Owners Association
  • Chincoteague Subdivision

Recreation

  • Pier or Dock
  • Seawall
  • Boat Ramp

Property Details

Property Type

Land

Est. Annual Taxes

$4,766

Year Built

1970

Lot Details

0

Listing Details

  • Property Sub Type: Unimproved Land
  • Prop. Type: Land
  • Lot Size Acres: 5
  • Lot Size: 5
  • Road Frontage Type: Highway
  • Water Body Name: Chincoteague Bay
  • Subdivision Name: Chincoteague
  • Directions: From the bridge turn right onto Main Street, follow towards the end of the Island. Property is on the right
  • Special Features: None
  • Year Built (Public Record): 1970

Interior Features

  • Possible Use: Residential, Business, Recreational, Commercial

Exterior Features

  • Lot Features: Open Lot, 5-9.0 acres +/-, 2-4.9 acres +/-
  • Topography: Level,Other-See Remarks
  • Waterfront Features: Water Front, Bay Front, Waterfront, Seawall, Boat Ramp, Pier/Dock
  • Waterfront: Yes
  • Other Structures: Structure As Is

Garage/Parking

  • Open Parking: Yes
  • Parking Features: Driveway

Utilities

  • Sewer: Septic Tank
  • Utilities: Electricity Available, Cable Available, Water Available, Phone Available

Condo/Co-op/Association

  • Association Fee Frequency: Annually
  • Association: No

Schools

  • Elementary School: Chincoteague Combined
  • High School: Chincoteague
  • Middle Or Junior School: Chincoteague Combined

Lot Info

  • Lot Size Sq Ft: 217800
  • Farm Land Area Units: Square Feet
  • Zoning Description: Other-See Remarks
  • ResoLotSizeUnits: Acres

Tax Info

  • Tax Annual Amount: 4766.12
  • Tax Book Number: 58-759, 2002-7878
  • Tax Lot: 50+
  • Tax Map Number: 45-A-7*
  • Tax Other Annual Assessment Amount: 783900

Range of Values:

Collateral Analytics

Collateral Analytics Collateral Analytics AVMs (Automated Valuation Model) employ a number of statistical approaches combined with neighborhood-specific comparable selection guarantees the most up-to-date and precise valuations.

Not Available

Collateral Analytics does not have data for the current month. Please view the chart for historical values.

ICE

ICE Mortgage Technology ICE Mortgage Technology’s AVM (Automated Valuation Model) is a state-of-the-art online residential property valuation tool that provides a quick and accurate estimate of the value of almost any home in the U.S.

Not Available

ICE Mortgage Technology does not have data for the current month. Please view the chart for historical values.

First American

First American First American Data & Analytics’ next-generation AVM combines unrivaled data assets with a blended ensemble of valuation models to produce highly accurate, reliable valuations you can trust.

Not Available

First American does not have data for the current month. Please view the chart for historical values.

Quantarium

Quantarium Quantarium’s valuation service, repeatedly proven the industry’s most accurate and comprehensive, is supercharged with a self-learning and auto-tuning AI engine that continually becomes smarter and more accurate as it processes daily inputs from the industry’s leading RE data lake.

Not Available

Quantarium does not have data for the current month. Please view the chart for historical values.

Average Value
Not Available
List Price
Sold Price
Create a Home Valuation Report for This Property
The Home Valuation Report is an in-depth analysis detailing your home's value as well as a comparison with similar homes in the area

Home Values in the Area

Source: Public Records

Average Home Value in this Area


Source: Public Records

Property History

Date Event Price Change Sq Ft Price
12/20/2021 12/20/21 Sold $2,300,000 -8.0% --
12/17/2021 12/17/21 Pending -- -- --
08/29/2020 08/29/20 For Sale $2,500,000 -- --
Source: Eastern Shore Association of REALTORS®

Tax History Compared to Growth

Source: Public Records

Tax History

Year Tax Paid Tax Assessment Tax Assessment Total Assessment is a certain percentage of the fair market value that is determined by local assessors to be the total taxable value of land and additions on the property. Land Improvement
2024 $11,153 $2,912,000 $2,200,800 $711,200
2023 $2,577 $554,100 $428,700 $125,400
2022 $1,756 $377,600 $252,200 $125,400
2021 $1,800 $375,000 $252,200 $122,800
2020 $1,800 $375,000 $252,200 $122,800
2019 $1,800 $375,000 $252,200 $122,800
2018 $1,800 $375,000 $252,200 $122,800
2017 $1,838 $375,000 $252,200 $122,800
2016 $1,838 $375,000 $252,200 $122,800
2015 $1,849 $377,300 $252,200 $125,100
2014 $1,849 $377,300 $252,200 $125,100
2013 -- $377,300 $252,200 $125,100
Source: Public Records

Agents Affiliated with this Home

  • Section Image
See All Agents

Map

Source: Eastern Shore Association of REALTORS®

MLS Number: 52312

APN: 045-00-A0-00-0007-00