Estimated Value: $396,482 - $443,000
2
Beds
2
Baths
1,677
Sq Ft
$246/Sq Ft
Est. Value
About This Home
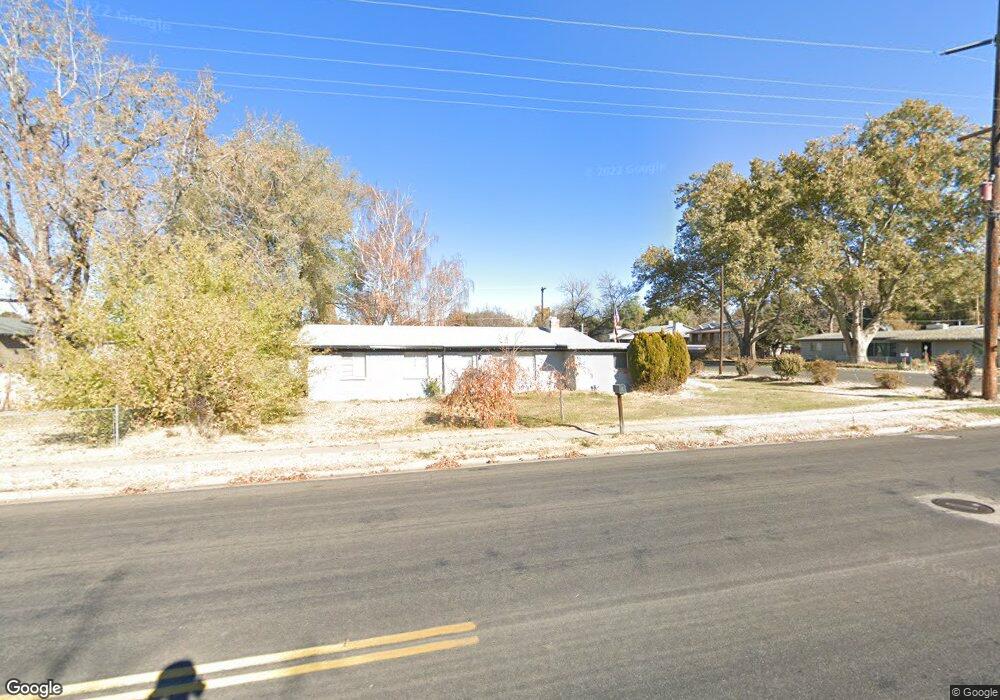
This home is located at 2478 W 6000 S, Roy, UT 84067 and is currently estimated at $412,371, approximately $245 per square foot. 2478 W 6000 S is a home located in Weber County with nearby schools including Municipal School, Roy Junior High School, and Roy High School.
Ownership History
Date
Name
Owned For
Owner Type
Purchase Details
Closed on
Jan 28, 2013
Sold by
King Sarah J and Fisher Sarah J
Bought by
King Sarah J
Current Estimated Value
Home Financials for this Owner
Home Financials are based on the most recent Mortgage that was taken out on this home.
Original Mortgage
$124,800
Interest Rate
3.33%
Mortgage Type
New Conventional
Purchase Details
Closed on
Jan 22, 2009
Sold by
Fisher Cary
Bought by
Fisher Sarah J
Home Financials for this Owner
Home Financials are based on the most recent Mortgage that was taken out on this home.
Original Mortgage
$128,000
Interest Rate
5.14%
Mortgage Type
New Conventional
Purchase Details
Closed on
Nov 15, 2007
Sold by
Gwilliam Keith H and Fisher Cary
Bought by
Gwilliam Keith H
Purchase Details
Closed on
Jan 25, 2000
Sold by
Gwilliam Keith H and Gwilliam Barbara
Bought by
Gwilliam Keith H and Gwilliam Barbara
Create a Home Valuation Report for This Property
The Home Valuation Report is an in-depth analysis detailing your home's value as well as a comparison with similar homes in the area
Home Values in the Area
Average Home Value in this Area
Purchase History
| Date | Buyer | Sale Price | Title Company |
|---|---|---|---|
| King Sarah J | -- | Inwest Title Ogden | |
| Fisher Sarah J | -- | Inwest Title Ogden | |
| Gwilliam Keith H | -- | First American Layton | |
| Gwilliam Keith H | -- | -- |
Source: Public Records
Mortgage History
| Date | Status | Borrower | Loan Amount |
|---|---|---|---|
| Closed | King Sarah J | $124,800 | |
| Closed | Fisher Sarah J | $128,000 |
Source: Public Records
Tax History
| Year | Tax Paid | Tax Assessment Tax Assessment Total Assessment is a certain percentage of the fair market value that is determined by local assessors to be the total taxable value of land and additions on the property. | Land | Improvement |
|---|---|---|---|---|
| 2025 | $2,368 | $363,526 | $122,189 | $241,337 |
| 2024 | $2,293 | $194,698 | $67,214 | $127,484 |
| 2023 | $2,134 | $180,401 | $58,807 | $121,594 |
| 2022 | $2,459 | $217,799 | $57,736 | $160,063 |
| 2021 | $1,871 | $268,001 | $69,210 | $198,791 |
| 2020 | $1,755 | $231,001 | $69,210 | $161,791 |
| 2019 | $1,721 | $214,000 | $44,343 | $169,657 |
| 2018 | $1,624 | $190,000 | $39,546 | $150,454 |
| 2017 | $1,510 | $165,000 | $42,523 | $122,477 |
| 2016 | $1,378 | $80,344 | $22,034 | $58,310 |
| 2015 | $1,338 | $80,343 | $24,885 | $55,458 |
| 2014 | $1,346 | $80,344 | $19,130 | $61,214 |
Source: Public Records
Map
Nearby Homes
Your Personal Tour Guide
Ask me questions while you tour the home.