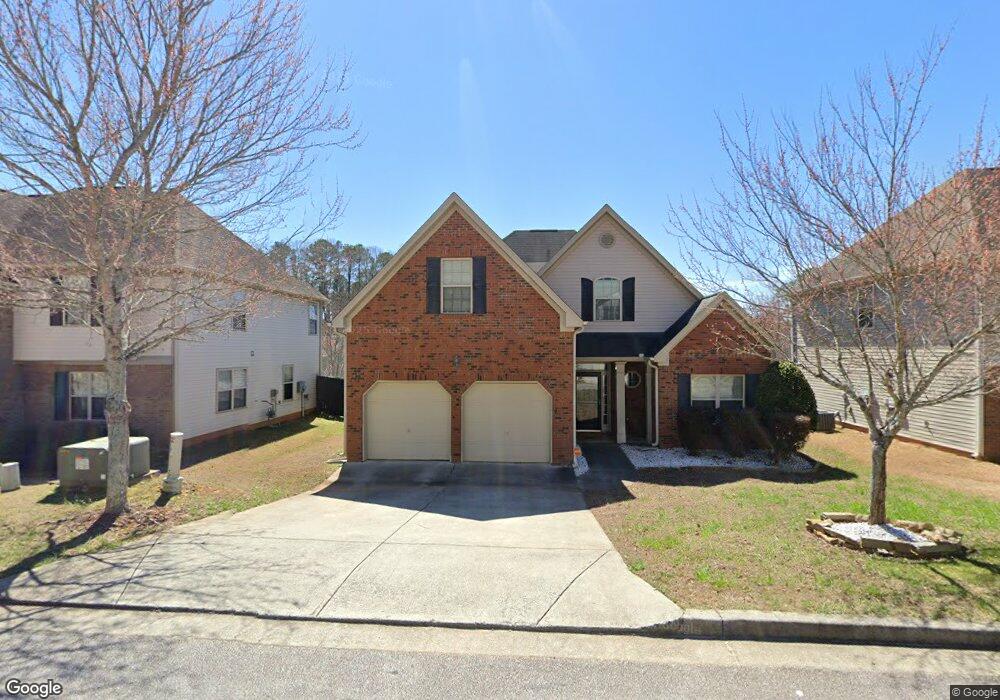
2479 Wingfield Dr Unit 26 Austell, GA 30106
Estimated Value: $359,680 - $378,000
5
Beds
3
Baths
2,040
Sq Ft
$181/Sq Ft
Est. Value
About This Home
This home is located at 2479 Wingfield Dr Unit 26, Austell, GA 30106 and is currently estimated at $368,670, approximately $180 per square foot. 2479 Wingfield Dr Unit 26 is a home located in Cobb County with nearby schools including Deerwood Elementary School, Clarkdale Elementary School, and Cooper Middle School.
Ownership History
Date
Name
Owned For
Owner Type
Purchase Details
Closed on
Sep 21, 2020
Sold by
Wasson Jodie A and Wasson Joshua D
Bought by
Wasson Jodie A
Current Estimated Value
Home Financials for this Owner
Home Financials are based on the most recent Mortgage that was taken out on this home.
Original Mortgage
$163,500
Outstanding Balance
$145,095
Interest Rate
2.9%
Mortgage Type
New Conventional
Estimated Equity
$223,575
Purchase Details
Closed on
Apr 29, 2014
Sold by
Boehling Meghan S
Bought by
Wasson Jodie A and Wasson Joshua D
Home Financials for this Owner
Home Financials are based on the most recent Mortgage that was taken out on this home.
Original Mortgage
$181,157
Interest Rate
4.4%
Mortgage Type
FHA
Purchase Details
Closed on
Jan 30, 2009
Sold by
W & H Properties Llc
Bought by
Boehling Meghan S
Home Financials for this Owner
Home Financials are based on the most recent Mortgage that was taken out on this home.
Original Mortgage
$181,649
Interest Rate
5.08%
Mortgage Type
FHA
Create a Home Valuation Report for This Property
The Home Valuation Report is an in-depth analysis detailing your home's value as well as a comparison with similar homes in the area
Home Values in the Area
Average Home Value in this Area
Purchase History
| Date | Buyer | Sale Price | Title Company |
|---|---|---|---|
| Wasson Jodie A | -- | None Available | |
| Wasson Jodie A | $184,500 | -- | |
| Boehling Meghan S | $185,000 | -- |
Source: Public Records
Mortgage History
| Date | Status | Borrower | Loan Amount |
|---|---|---|---|
| Open | Wasson Jodie A | $163,500 | |
| Closed | Wasson Jodie A | $181,157 | |
| Previous Owner | Boehling Meghan S | $181,649 |
Source: Public Records
Tax History Compared to Growth
Tax History
| Year | Tax Paid | Tax Assessment Tax Assessment Total Assessment is a certain percentage of the fair market value that is determined by local assessors to be the total taxable value of land and additions on the property. | Land | Improvement |
|---|---|---|---|---|
| 2025 | $3,807 | $140,000 | $17,480 | $122,520 |
| 2024 | $3,810 | $140,000 | $17,480 | $122,520 |
| 2023 | $3,267 | $140,000 | $17,480 | $122,520 |
| 2022 | $2,913 | $123,480 | $18,000 | $105,480 |
| 2021 | $2,136 | $87,984 | $18,000 | $69,984 |
| 2020 | $2,136 | $87,984 | $18,000 | $69,984 |
| 2019 | $1,869 | $75,792 | $12,800 | $62,992 |
| 2018 | $1,679 | $67,084 | $12,800 | $54,284 |
| 2017 | $1,605 | $67,084 | $12,800 | $54,284 |
| 2016 | $1,388 | $57,176 | $12,800 | $44,376 |
| 2015 | $1,424 | $57,176 | $12,800 | $44,376 |
| 2014 | $1,436 | $57,176 | $0 | $0 |
Source: Public Records
Map
Nearby Homes
- 6025 Park Wood Ct
- 2331 Weslan Dr
- 2713 Flintlock Place
- 2763 Whitewater Ct
- 2918 Egret Ln
- 2711 Greystone Ct
- 5069 Flint Hill Rd Unit AB
- 5069 A B Flint Hill Rd
- 2650 Park Ave
- 2276 Clay Rd SW
- 4747 Nelda Dr
- 4644 Egret Ct
- 2236 Clay Rd
- 2125 Clay Rd SW
- 4598 Flint Hill Rd
- 2539 Dogwood Hills Ct
- 2373 Buckley Ct
- 2349 Shire Ct
- 2479 Wingfield Dr SW Unit 26
- 2479 Wingfield Dr
- 2483 Wingfield Dr
- 2475 Wingfield Dr
- 2482 Wingfield Dr
- 2478 Wingfield Dr SW
- 4865 Chimney Hill Ct
- 4855 Chimney Hill Ct
- 2486 Wingfield Dr
- 2474 Wingfield Dr
- 4875 Chimney Hill Ct
- 4885 Chimney Hill Ct
- 0 Wingfield Dr SW Unit 7371915
- 0 Wingfield Dr SW Unit 8521790
- 0 Wingfield Dr SW Unit 7593808
- 0 Wingfield Dr SW Unit 7494545
- 0 Wingfield Dr SW Unit 7020110
- 0 Wingfield Dr SW Unit 8941110
- 2490 Wingfield Dr
- 0 Chimney Hill Ct Unit 8672096