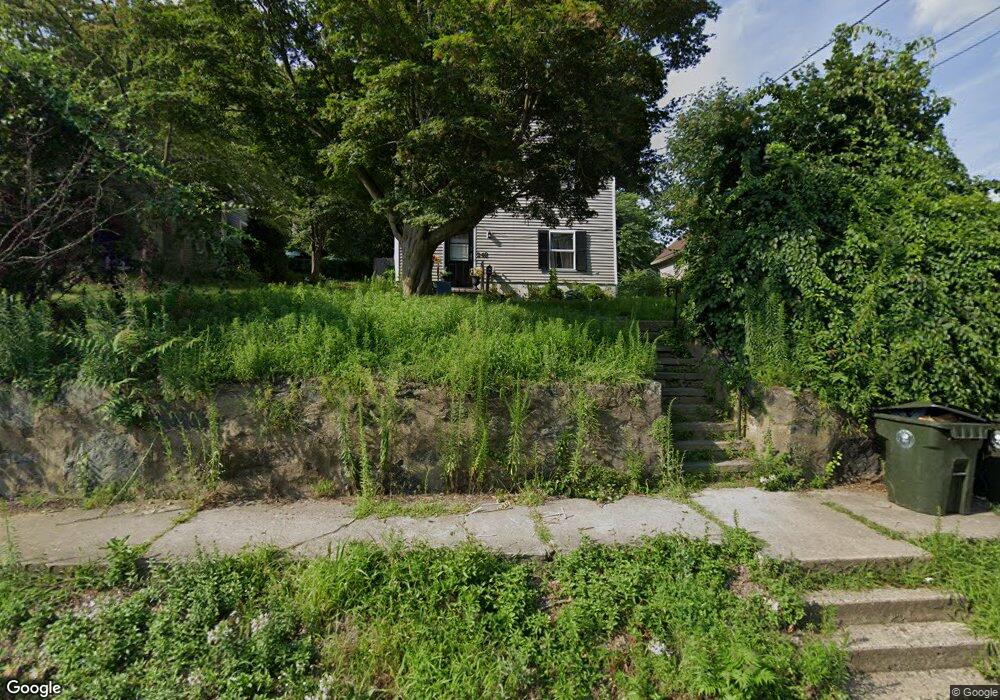
248 Broad St Norwich, CT 06360
Central Norwich NeighborhoodEstimated Value: $228,000 - $272,000
3
Beds
2
Baths
1,050
Sq Ft
$246/Sq Ft
Est. Value
About This Home
This home is located at 248 Broad St, Norwich, CT 06360 and is currently estimated at $258,426, approximately $246 per square foot. 248 Broad St is a home located in New London County with nearby schools including Moriarty Magnet Elementary School, Kelly STEAM Magnet Middle School, and Integrated Day Charter School.
Ownership History
Date
Name
Owned For
Owner Type
Purchase Details
Closed on
May 8, 2002
Sold by
Habitat For Humanity
Bought by
White Darrell and White Amy
Current Estimated Value
Home Financials for this Owner
Home Financials are based on the most recent Mortgage that was taken out on this home.
Original Mortgage
$63,500
Interest Rate
7.18%
Purchase Details
Closed on
Jun 29, 2000
Sold by
Brown Jennifer and Brown Stephen
Bought by
Habitat Humanity Se
Create a Home Valuation Report for This Property
The Home Valuation Report is an in-depth analysis detailing your home's value as well as a comparison with similar homes in the area
Home Values in the Area
Average Home Value in this Area
Purchase History
| Date | Buyer | Sale Price | Title Company |
|---|---|---|---|
| White Darrell | $63,500 | -- | |
| White Darrell | $63,500 | -- | |
| Habitat Humanity Se | $6,500 | -- |
Source: Public Records
Mortgage History
| Date | Status | Borrower | Loan Amount |
|---|---|---|---|
| Open | Habitat Humanity Se | $125,000 | |
| Closed | Habitat Humanity Se | $63,500 |
Source: Public Records
Tax History Compared to Growth
Tax History
| Year | Tax Paid | Tax Assessment Tax Assessment Total Assessment is a certain percentage of the fair market value that is determined by local assessors to be the total taxable value of land and additions on the property. | Land | Improvement |
|---|---|---|---|---|
| 2025 | $6,002 | $148,300 | $28,500 | $119,800 |
| 2024 | $5,665 | $148,300 | $28,500 | $119,800 |
| 2023 | $4,723 | $97,100 | $20,200 | $76,900 |
| 2022 | $4,707 | $97,100 | $20,200 | $76,900 |
| 2021 | $4,723 | $97,100 | $20,200 | $76,900 |
| 2020 | $4,706 | $97,100 | $20,200 | $76,900 |
| 2019 | $4,660 | $97,100 | $20,200 | $76,900 |
| 2018 | $4,728 | $97,700 | $23,700 | $74,000 |
| 2017 | $4,762 | $97,700 | $23,700 | $74,000 |
| 2016 | $4,793 | $97,700 | $23,700 | $74,000 |
| 2015 | $4,695 | $97,700 | $23,700 | $74,000 |
| 2014 | $4,487 | $97,700 | $23,700 | $74,000 |
Source: Public Records
Map
Nearby Homes