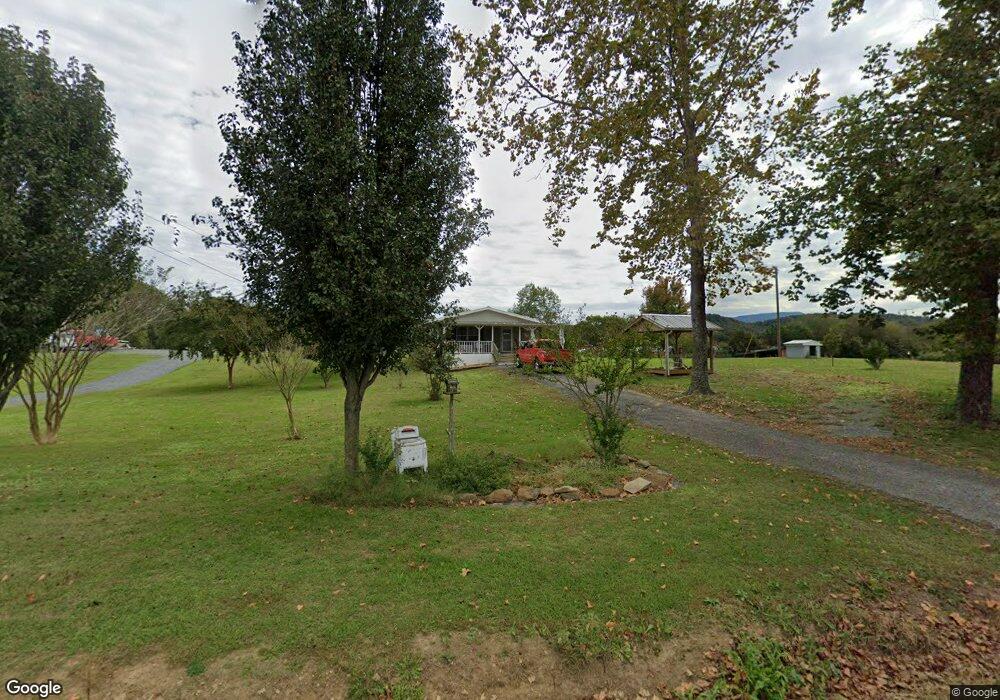
248 Caylor Rd Crandall, GA 30711
Cisco NeighborhoodEstimated Value: $147,598 - $199,000
--
Bed
1
Bath
1,048
Sq Ft
$163/Sq Ft
Est. Value
About This Home
This home is located at 248 Caylor Rd, Crandall, GA 30711 and is currently estimated at $171,150, approximately $163 per square foot. 248 Caylor Rd is a home located in Murray County with nearby schools including Northwest Elementary School, Bagley Middle School, and North Murray High School.
Ownership History
Date
Name
Owned For
Owner Type
Purchase Details
Closed on
Aug 21, 2025
Sold by
Glass John H
Bought by
Gibson Brian and Gibson Sheila Renay
Current Estimated Value
Purchase Details
Closed on
Aug 6, 2008
Sold by
Not Provided
Bought by
Glass John H and Glass John E
Purchase Details
Closed on
Jul 1, 2008
Sold by
Weaver James W
Bought by
Little D Farms Inc
Purchase Details
Closed on
Mar 27, 2008
Sold by
Little D Farms Inc
Bought by
Weaver James W
Purchase Details
Closed on
Apr 3, 2007
Sold by
Pinson Timothy H
Bought by
Little D Farms Inc
Purchase Details
Closed on
May 4, 2004
Sold by
Dunn Oleta and Dunn Julius
Bought by
Pinson Timothy H and Trebar Christina
Purchase Details
Closed on
Mar 30, 2004
Sold by
Dunn Julius and Dunn Oleta D
Bought by
Little D Farms Inc
Purchase Details
Closed on
Nov 17, 2003
Sold by
Little D Farms Inc
Bought by
Dunn Julius and Dunn Oleta D
Purchase Details
Closed on
Mar 30, 2002
Sold by
Little D Farms
Bought by
Dunn Julius and Dunn Oleta D
Purchase Details
Closed on
Mar 5, 1999
Sold by
Dunn Julius and Dunn Oleta
Bought by
Little D Farms Inc
Create a Home Valuation Report for This Property
The Home Valuation Report is an in-depth analysis detailing your home's value as well as a comparison with similar homes in the area
Home Values in the Area
Average Home Value in this Area
Purchase History
| Date | Buyer | Sale Price | Title Company |
|---|---|---|---|
| Gibson Brian | $40,000 | -- | |
| Glass John H | -- | -- | |
| Little D Farms Inc | $29,500 | -- | |
| Weaver James W | $30,000 | -- | |
| Little D Farms Inc | -- | -- | |
| Pinson Timothy H | $65,000 | -- | |
| Little D Farms Inc | -- | -- | |
| Dunn Julius | -- | -- | |
| Dunn Julius | -- | -- | |
| Little D Farms Inc | -- | -- |
Source: Public Records
Tax History Compared to Growth
Tax History
| Year | Tax Paid | Tax Assessment Tax Assessment Total Assessment is a certain percentage of the fair market value that is determined by local assessors to be the total taxable value of land and additions on the property. | Land | Improvement |
|---|---|---|---|---|
| 2024 | -- | $54,096 | $21,960 | $32,136 |
| 2023 | $0 | $54,568 | $21,960 | $32,608 |
| 2022 | $1,196 | $49,848 | $21,960 | $27,888 |
| 2021 | $1,085 | $43,928 | $21,960 | $21,968 |
| 2020 | $253 | $39,808 | $21,960 | $17,848 |
| 2019 | $256 | $39,808 | $21,960 | $17,848 |
| 2018 | $256 | $39,808 | $21,960 | $17,848 |
| 2017 | $0 | $37,048 | $21,960 | $15,088 |
| 2016 | $166 | $35,140 | $21,960 | $13,180 |
| 2015 | -- | $35,140 | $21,960 | $13,180 |
| 2014 | -- | $35,140 | $21,960 | $13,180 |
| 2013 | -- | $34,340 | $21,960 | $12,380 |
Source: Public Records
Map
Nearby Homes
- 1339 Richard Bennett Rd
- 0 Doctor Johnson Rd
- 396 Doctor Johnson Rd
- 10104 Georgia 225 Unit 4
- 44 Brush Town Rd
- 910 Brushtown Rd
- 19 Highway 411
- 1141 Brush Town Rd
- 247 Ac Maddron Rd
- 1639 Tennga Gregory Rd
- 242 AC Maddron Rd
- 205+ Ac Maddron Rd
- Landlot 19 Highway 411
- 00 Georgia 2
- 0 Georgia 2
- 2499 Sugar Creek Rd
- 1371 Halls Chapel Rd
- 9338 Hwy 255n
- 1643 Sugar Creek Rd
- 0 Baxter Rd
- 0 Caylor Dr
- 241 Caylor Rd
- 371 Caylor Rd
- 125 Caylor Rd
- 382 Caylor Rd
- 400 Caylor Rd
- 83 Caylor Rd
- 1885 Richard Bennett Rd
- 465 Caylor Rd
- 1997 Richard Bennett Rd
- 1997 Richard Bennett Rd
- 2051 Richard Bennett Rd
- 2165 Richard Bennett Rd
- 1930 Richard Bennett Rd
- 260 Dunn Rd W
- 2193 Richard Bennett Rd
- 1890 Richard Bennett Rd
- 0 Dunn Rd E Unit 87093
- 0 Dunn Rd E Unit 87087
- 0 Dunn Rd E Unit 104796