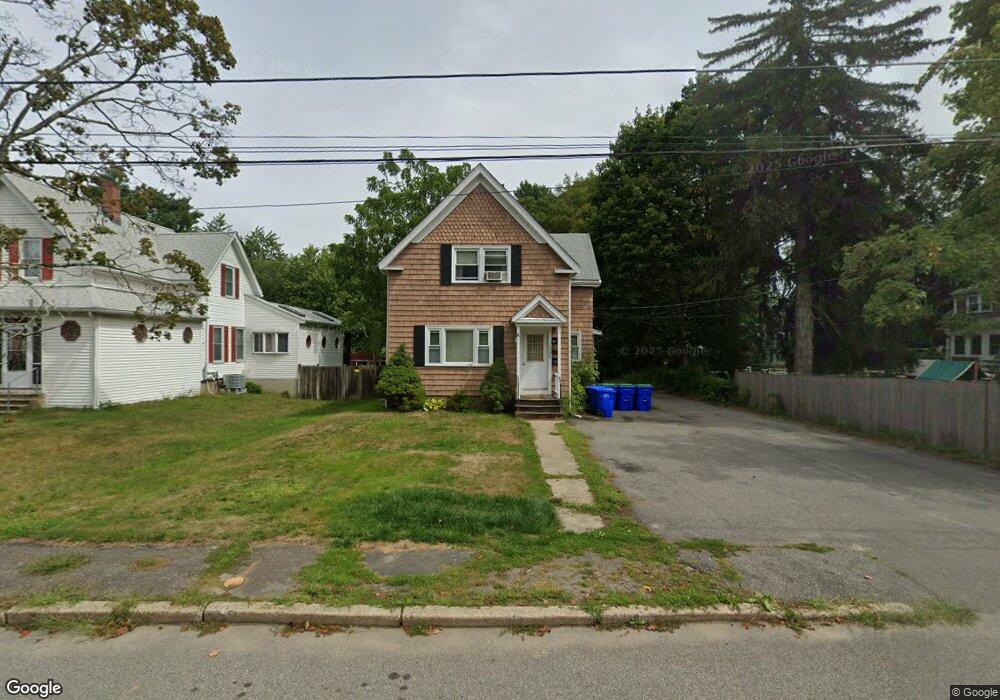
248 Crescent St Rockland, MA 02370
Estimated Value: $582,884 - $710,000
--
Bed
3
Baths
1,768
Sq Ft
$370/Sq Ft
Est. Value
About This Home
This home is located at 248 Crescent St, Rockland, MA 02370 and is currently estimated at $654,721, approximately $370 per square foot. 248 Crescent St is a home located in Plymouth County with nearby schools including Rockland Senior High School, Calvary Chapel Academy, and Holy Family Elementary School.
Ownership History
Date
Name
Owned For
Owner Type
Purchase Details
Closed on
Feb 12, 2015
Sold by
Deminico David M and Deminico Kathi L
Bought by
248 Crescent Street Rt
Current Estimated Value
Purchase Details
Closed on
Dec 10, 1993
Sold by
Macmillan Kenneth L and Macmillan Irene J
Bought by
Deminico David M and Diminico Kathleen J
Home Financials for this Owner
Home Financials are based on the most recent Mortgage that was taken out on this home.
Original Mortgage
$133,000
Interest Rate
6.78%
Mortgage Type
Purchase Money Mortgage
Create a Home Valuation Report for This Property
The Home Valuation Report is an in-depth analysis detailing your home's value as well as a comparison with similar homes in the area
Home Values in the Area
Average Home Value in this Area
Purchase History
| Date | Buyer | Sale Price | Title Company |
|---|---|---|---|
| 248 Crescent Street Rt | -- | -- | |
| Deminico David M | $140,000 | -- |
Source: Public Records
Mortgage History
| Date | Status | Borrower | Loan Amount |
|---|---|---|---|
| Previous Owner | Deminico David M | $120,350 | |
| Previous Owner | Deminico David M | $22,700 | |
| Previous Owner | Deminico David M | $133,000 |
Source: Public Records
Tax History Compared to Growth
Tax History
| Year | Tax Paid | Tax Assessment Tax Assessment Total Assessment is a certain percentage of the fair market value that is determined by local assessors to be the total taxable value of land and additions on the property. | Land | Improvement |
|---|---|---|---|---|
| 2025 | $6,799 | $497,400 | $224,600 | $272,800 |
| 2024 | $6,601 | $469,500 | $211,800 | $257,700 |
| 2023 | $6,414 | $421,400 | $184,600 | $236,800 |
| 2022 | $6,147 | $367,000 | $160,500 | $206,500 |
| 2021 | $6,610 | $325,600 | $145,900 | $179,700 |
| 2020 | $5,430 | $310,300 | $139,000 | $171,300 |
| 2019 | $6,949 | $280,600 | $132,400 | $148,200 |
| 2018 | $4,783 | $262,500 | $132,400 | $130,100 |
| 2017 | $4,509 | $244,000 | $125,400 | $118,600 |
| 2016 | $4,341 | $234,800 | $120,600 | $114,200 |
| 2015 | $4,318 | $226,900 | $112,700 | $114,200 |
| 2014 | $4,095 | $223,300 | $110,500 | $112,800 |
Source: Public Records
Map
Nearby Homes