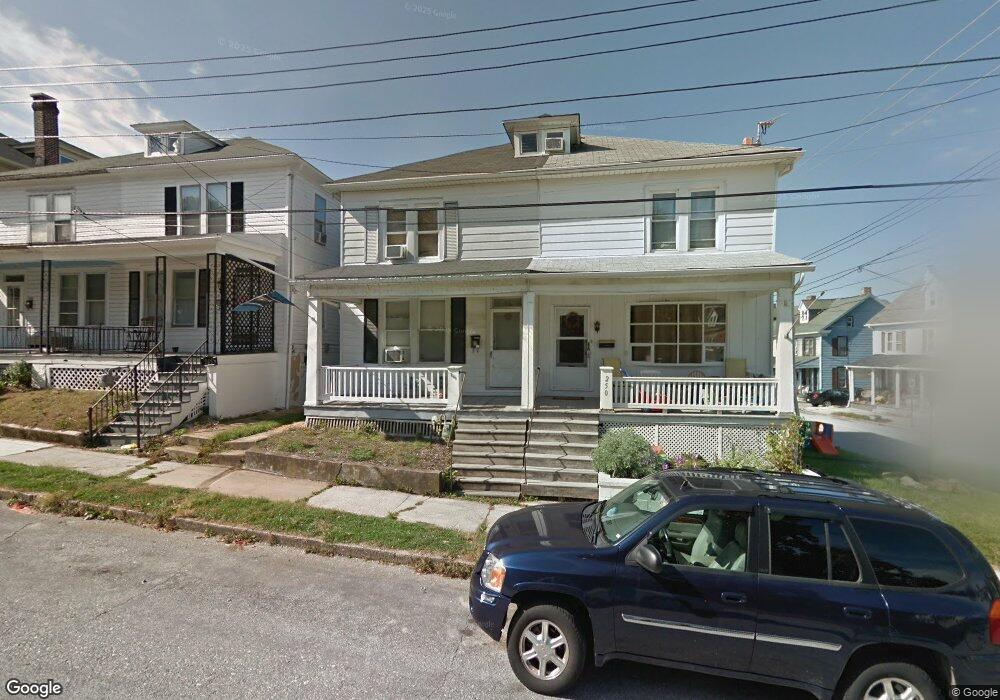
248 N Charles St Red Lion, PA 17356
Estimated Value: $163,000 - $191,000
4
Beds
1
Bath
1,728
Sq Ft
$104/Sq Ft
Est. Value
About This Home
This home is located at 248 N Charles St, Red Lion, PA 17356 and is currently estimated at $179,105, approximately $103 per square foot. 248 N Charles St is a home located in York County with nearby schools including Mazie Gable Elementary School, Red Lion Area Junior High School, and Red Lion Area Senior High School.
Ownership History
Date
Name
Owned For
Owner Type
Purchase Details
Closed on
Oct 21, 2021
Sold by
Stauffer Jud F and Stauffer Sandra F
Bought by
Yerger Steven L
Current Estimated Value
Purchase Details
Closed on
Jul 17, 2008
Sold by
Bennett Edward Eugene and Bennett Trena Diane
Bought by
May Melissa R and May Mark R
Home Financials for this Owner
Home Financials are based on the most recent Mortgage that was taken out on this home.
Original Mortgage
$81,200
Interest Rate
6.49%
Mortgage Type
New Conventional
Purchase Details
Closed on
Nov 29, 2004
Sold by
Hagy Troy M and Hagy Lori A
Bought by
May Melissa R and Bennett Edward Eugene
Home Financials for this Owner
Home Financials are based on the most recent Mortgage that was taken out on this home.
Original Mortgage
$77,884
Interest Rate
5.74%
Mortgage Type
FHA
Create a Home Valuation Report for This Property
The Home Valuation Report is an in-depth analysis detailing your home's value as well as a comparison with similar homes in the area
Home Values in the Area
Average Home Value in this Area
Purchase History
| Date | Buyer | Sale Price | Title Company |
|---|---|---|---|
| Yerger Steven L | $25,000 | None Available | |
| May Melissa R | -- | None Available | |
| May Melissa R | $78,500 | -- |
Source: Public Records
Mortgage History
| Date | Status | Borrower | Loan Amount |
|---|---|---|---|
| Previous Owner | May Melissa R | $81,200 | |
| Previous Owner | May Melissa R | $77,884 |
Source: Public Records
Tax History Compared to Growth
Tax History
| Year | Tax Paid | Tax Assessment Tax Assessment Total Assessment is a certain percentage of the fair market value that is determined by local assessors to be the total taxable value of land and additions on the property. | Land | Improvement |
|---|---|---|---|---|
| 2025 | $2,597 | $75,150 | $23,920 | $51,230 |
| 2024 | $2,493 | $75,150 | $23,920 | $51,230 |
| 2023 | $2,493 | $75,150 | $23,920 | $51,230 |
| 2022 | $2,493 | $75,150 | $23,920 | $51,230 |
| 2021 | $2,433 | $75,150 | $23,920 | $51,230 |
| 2020 | $2,433 | $75,150 | $23,920 | $51,230 |
| 2019 | $2,426 | $75,150 | $23,920 | $51,230 |
| 2018 | $2,426 | $75,150 | $23,920 | $51,230 |
| 2017 | $2,426 | $75,150 | $23,920 | $51,230 |
| 2016 | $0 | $75,150 | $23,920 | $51,230 |
| 2015 | -- | $75,150 | $23,920 | $51,230 |
| 2014 | -- | $75,150 | $23,920 | $51,230 |
Source: Public Records
Map
Nearby Homes
- 217 N Charles St
- 270 N Main St
- 118 Keener Ave
- 79 1st Ave
- 81 1st Ave Unit E
- 400 Carriage Ln Unit 400
- 503 W Broadway
- 314 Boundary Ave
- 157 E Broadway
- 116 S Franklin St
- 620 Boundary Ave
- 202 S Main St
- 214 Equine Cove Unit 214
- 28 Pleasant Ave
- 3366 Cape Horn Rd
- 121 Furlong Way Unit 121
- 0 Cape Horn Rd
- 126 Country Ridge Dr
- 227 Jutland Way
- 630 Woodland Ave