Estimated Value: $198,749 - $240,000
--
Bed
2
Baths
1,315
Sq Ft
$169/Sq Ft
Est. Value
About This Home
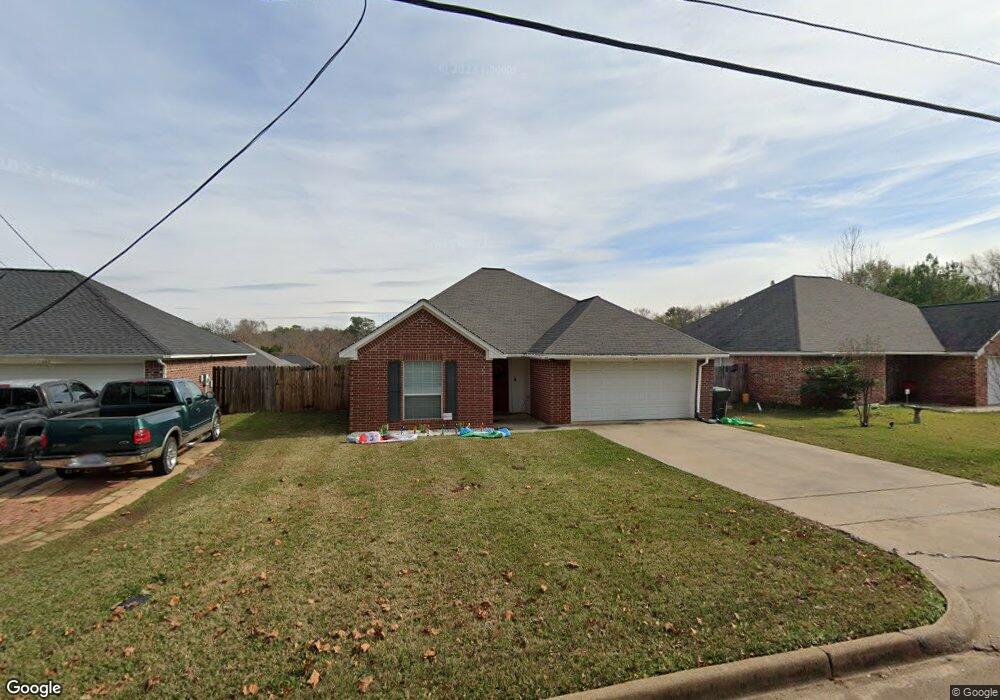
This home is located at 248 S Palmer Ave, Tyler, TX 75702 and is currently estimated at $221,937, approximately $168 per square foot. 248 S Palmer Ave is a home located in Smith County with nearby schools including Bonner Elementary School, Moore Middle School, and Tyler High School.
Ownership History
Date
Name
Owned For
Owner Type
Purchase Details
Closed on
Dec 12, 2016
Sold by
Beverly Jonathan
Bought by
Gama Dennis
Current Estimated Value
Home Financials for this Owner
Home Financials are based on the most recent Mortgage that was taken out on this home.
Original Mortgage
$101,700
Outstanding Balance
$81,557
Interest Rate
3.47%
Mortgage Type
New Conventional
Estimated Equity
$140,380
Purchase Details
Closed on
Sep 26, 2011
Sold by
Laird Nathan A and Laird Gretchen B
Bought by
Beverly Sherry Elaine
Home Financials for this Owner
Home Financials are based on the most recent Mortgage that was taken out on this home.
Original Mortgage
$90,809
Interest Rate
4.25%
Mortgage Type
FHA
Purchase Details
Closed on
Aug 5, 2005
Sold by
Maddox Homes Incorporated
Bought by
Laird Nathan A
Home Financials for this Owner
Home Financials are based on the most recent Mortgage that was taken out on this home.
Original Mortgage
$18,500
Interest Rate
5.65%
Mortgage Type
Stand Alone Second
Create a Home Valuation Report for This Property
The Home Valuation Report is an in-depth analysis detailing your home's value as well as a comparison with similar homes in the area
Home Values in the Area
Average Home Value in this Area
Purchase History
| Date | Buyer | Sale Price | Title Company |
|---|---|---|---|
| Gama Dennis | -- | None Available | |
| Beverly Sherry Elaine | -- | None Available | |
| Laird Nathan A | -- | None Available |
Source: Public Records
Mortgage History
| Date | Status | Borrower | Loan Amount |
|---|---|---|---|
| Open | Gama Dennis | $101,700 | |
| Previous Owner | Beverly Sherry Elaine | $90,809 | |
| Previous Owner | Laird Nathan A | $18,500 | |
| Previous Owner | Laird Nathan A | $74,100 |
Source: Public Records
Tax History Compared to Growth
Tax History
| Year | Tax Paid | Tax Assessment Tax Assessment Total Assessment is a certain percentage of the fair market value that is determined by local assessors to be the total taxable value of land and additions on the property. | Land | Improvement |
|---|---|---|---|---|
| 2024 | $1,722 | $157,495 | $16,561 | $181,095 |
| 2023 | $2,496 | $193,621 | $16,561 | $177,060 |
| 2022 | $2,550 | $141,769 | $16,561 | $125,208 |
| 2021 | $2,483 | $118,328 | $16,561 | $101,767 |
| 2020 | $2,532 | $118,328 | $16,561 | $101,767 |
| 2019 | $2,458 | $112,407 | $14,527 | $97,880 |
| 2018 | $2,330 | $107,121 | $14,527 | $92,594 |
| 2017 | $2,287 | $107,121 | $14,527 | $92,594 |
| 2016 | $2,168 | $101,541 | $14,527 | $87,014 |
| 2015 | $2,039 | $97,966 | $14,527 | $83,439 |
| 2014 | $2,039 | $95,977 | $14,527 | $81,450 |
Source: Public Records
Map
Nearby Homes
- 207 Patricia Ct
- 1220 E Front St
- 1317 & 1326 E Earle St
- 1513 E Lawrence St
- 1704 E Houston St
- 1919 E Ferdell St
- 200 N Horace Ave
- 1417 E Oakwood St
- 613 S Baxter Ave
- 1314 E Dawson St
- 1432 E Don St
- 837 S Palmer Ave
- 1131 E Commerce St
- 912 S Palmer Ave
- 834 S Tipton Ave
- 2313 Danica Dr
- 1528 E Devine St
- 2607 Old Henderson Hwy
- 1910 E Lake St
- 1914 Parklen St
- 248 248 S Palmer
- 254 S Palmer Ave
- 236 S Palmer Ave
- 228 228 S Palmer
- 215 Patricia Ct
- 228 S Palmer Ave
- 215 215 Patricia Ct
- 211 Patricia Ct
- 219 Patricia Ct
- 262 S Palmer Ave
- 207 207 Patricia Ct
- 220 220 S Palmer
- 220 S Palmer Ave
- 223 Patricia Ct
- 245 S Palmer Ave
- 251 S Palmer Ave
- 229 S Palmer Ave
- 203 Patricia Ct
- 1705 E Richards St
- 1709 E Richards St