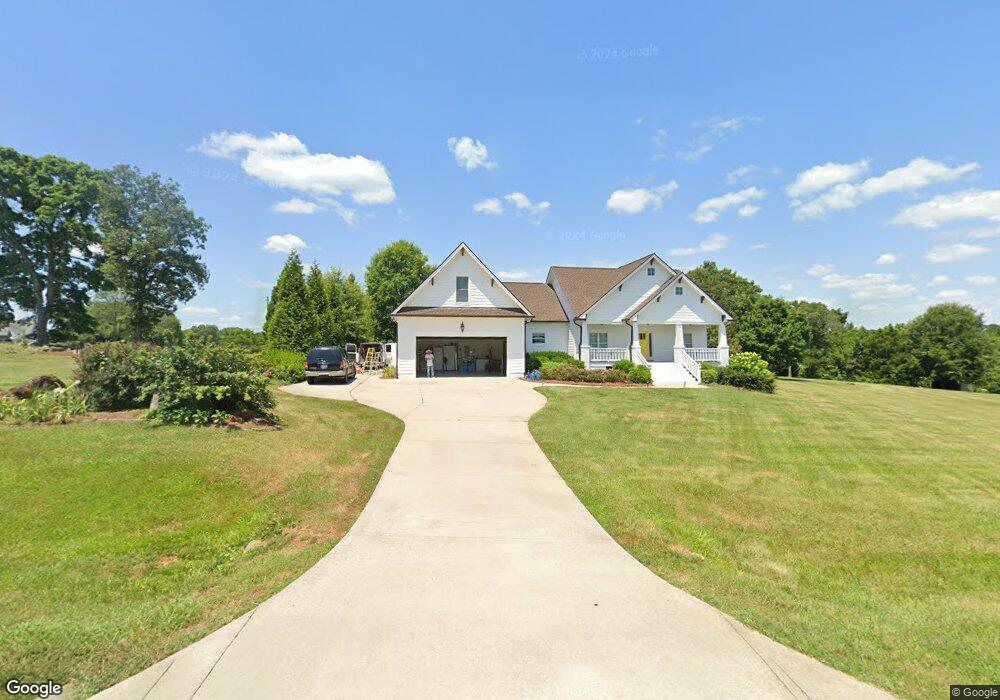
248 Shambley Meadows Dr Pittsboro, NC 27312
Estimated Value: $614,000 - $732,000
4
Beds
4
Baths
2,966
Sq Ft
$231/Sq Ft
Est. Value
About This Home
This home is located at 248 Shambley Meadows Dr, Pittsboro, NC 27312 and is currently estimated at $684,040, approximately $230 per square foot. 248 Shambley Meadows Dr is a home located in Chatham County with nearby schools including Pittsboro Elementary School, George Moses Horton Middle School, and Northwood High.
Ownership History
Date
Name
Owned For
Owner Type
Purchase Details
Closed on
Jul 17, 2020
Sold by
Stein Melaney M and Stein Ronald D
Bought by
Montesinos Olvera Silvia J and Moreno Escoto Juan
Current Estimated Value
Home Financials for this Owner
Home Financials are based on the most recent Mortgage that was taken out on this home.
Original Mortgage
$283,000
Outstanding Balance
$250,385
Interest Rate
3.1%
Mortgage Type
New Conventional
Estimated Equity
$433,655
Purchase Details
Closed on
Mar 11, 2016
Sold by
Baswell Phillip and Baswell Abegail
Bought by
Stein Ronald D and Stein Melaney M
Home Financials for this Owner
Home Financials are based on the most recent Mortgage that was taken out on this home.
Original Mortgage
$311,850
Interest Rate
3.65%
Mortgage Type
New Conventional
Purchase Details
Closed on
Sep 25, 2009
Sold by
H & A Properties Inc
Bought by
Baswell Phillip and Baswell Abegail
Home Financials for this Owner
Home Financials are based on the most recent Mortgage that was taken out on this home.
Original Mortgage
$353,286
Interest Rate
5.05%
Mortgage Type
VA
Create a Home Valuation Report for This Property
The Home Valuation Report is an in-depth analysis detailing your home's value as well as a comparison with similar homes in the area
Home Values in the Area
Average Home Value in this Area
Purchase History
| Date | Buyer | Sale Price | Title Company |
|---|---|---|---|
| Montesinos Olvera Silvia J | $430,000 | None Available | |
| Stein Ronald D | $346,500 | Attorney | |
| Baswell Phillip | $342,000 | None Available |
Source: Public Records
Mortgage History
| Date | Status | Borrower | Loan Amount |
|---|---|---|---|
| Open | Montesinos Olvera Silvia J | $283,000 | |
| Previous Owner | Stein Ronald D | $311,850 | |
| Previous Owner | Baswell Phillip | $353,286 |
Source: Public Records
Tax History Compared to Growth
Tax History
| Year | Tax Paid | Tax Assessment Tax Assessment Total Assessment is a certain percentage of the fair market value that is determined by local assessors to be the total taxable value of land and additions on the property. | Land | Improvement |
|---|---|---|---|---|
| 2025 | $4,446 | $614,941 | $86,200 | $528,741 |
| 2024 | $4,446 | $415,462 | $62,200 | $353,262 |
| 2023 | $3,554 | $415,462 | $62,200 | $353,262 |
| 2022 | $3,231 | $415,462 | $62,200 | $353,262 |
| 2021 | $3,231 | $415,462 | $62,200 | $353,262 |
| 2020 | $2,693 | $343,035 | $50,400 | $292,635 |
| 2019 | $2,693 | $343,035 | $50,400 | $292,635 |
| 2018 | $2,515 | $343,035 | $50,400 | $292,635 |
| 2017 | $2,481 | $343,035 | $50,400 | $292,635 |
| 2016 | $2,365 | $323,856 | $48,000 | $275,856 |
| 2015 | $2,327 | $323,856 | $48,000 | $275,856 |
| 2014 | $2,327 | $323,856 | $48,000 | $275,856 |
| 2013 | -- | $323,856 | $48,000 | $275,856 |
Source: Public Records
Map
Nearby Homes
- 344 Singing Hills Dr
- 710 Hadley Mill Rd
- 26 Shadymont Dr
- 1545 Alex Cockman Rd
- 1838 Alex Cockman Rd
- 1529 Hillside Dairy Rd
- 001 Turn Key Way
- TBD Pleasant Hill Church Rd
- 5982 Pleasant Hill Church Rd
- 142 Neil Carter Dr
- 292 Choice Trail
- 2806 Pleasant Hill Church Rd
- 1565 Bowers Store Rd
- Lot 1 D Turkey Buzzard Ln
- Lot 1 C Turkey Buzzard Ln
- Lot 1 B Turkey Buzzard Ln
- 457 Zeb Ferguson Rd
- 0000 Zeb Ferguson Rd
- Lot 4 Zeb Ferguson Rd
- 469 Zeb Ferguson Rd
- 274 Shambley Meadows Dr
- 232 Shambley Meadows Dr
- 305 Shambley Meadows Dr
- 88 Singing Hills Dr
- 316 Shambley Meadows Dr
- 204 Shambley Meadows Dr
- 241 Shambley Meadows Dr
- 341 Shambley Meadows Dr
- 44 Singing Hills Dr
- 120 Jay Shambley Rd
- 208 Singing Hills Dr
- 45 Blarney Stone Cir
- 179 Shambley Meadows Dr
- 90 Jay Shambley Rd
- 51 Blarney Stone Cir
- 141 Shambley Meadows Dr
- 270 Singing Hills Dr
- 211 Singing Hills Dr
- 42 Blarney Stone Cir
- 276 Jay Shambley Rd