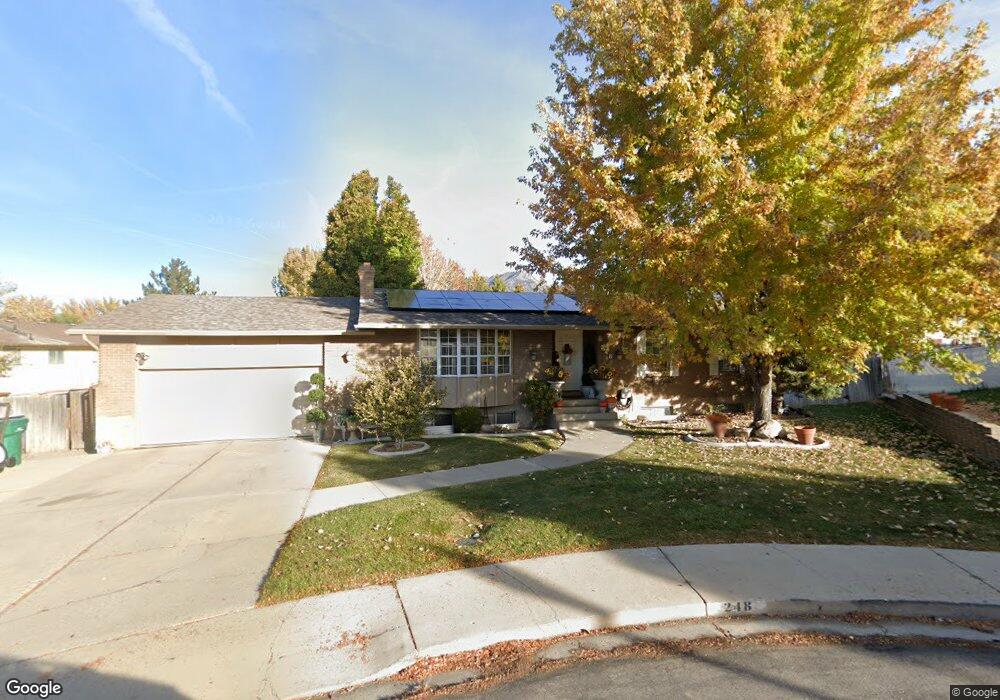
248 W 1950 N Orem, UT 84057
Northridge NeighborhoodEstimated Value: $506,000 - $645,000
6
Beds
3
Baths
2,752
Sq Ft
$211/Sq Ft
Est. Value
About This Home
This home is located at 248 W 1950 N, Orem, UT 84057 and is currently estimated at $580,017, approximately $210 per square foot. 248 W 1950 N is a home located in Utah County with nearby schools including Northridge Elementary School, Oak Canyon Junior High School, and Timpanogos High School.
Ownership History
Date
Name
Owned For
Owner Type
Purchase Details
Closed on
Oct 23, 2012
Sold by
Simpson Miriam
Bought by
Barragan Patricia
Current Estimated Value
Home Financials for this Owner
Home Financials are based on the most recent Mortgage that was taken out on this home.
Original Mortgage
$105,000
Outstanding Balance
$72,675
Interest Rate
3.5%
Mortgage Type
New Conventional
Estimated Equity
$507,342
Purchase Details
Closed on
Oct 16, 2008
Sold by
Sabin Keith A and Sabin Susan E
Bought by
Simpson Miriam
Home Financials for this Owner
Home Financials are based on the most recent Mortgage that was taken out on this home.
Original Mortgage
$227,905
Interest Rate
5.77%
Mortgage Type
Purchase Money Mortgage
Create a Home Valuation Report for This Property
The Home Valuation Report is an in-depth analysis detailing your home's value as well as a comparison with similar homes in the area
Home Values in the Area
Average Home Value in this Area
Purchase History
| Date | Buyer | Sale Price | Title Company |
|---|---|---|---|
| Barragan Patricia | -- | Select Title Insurance Agenc | |
| Simpson Miriam | -- | Equity Title Orem Blvd |
Source: Public Records
Mortgage History
| Date | Status | Borrower | Loan Amount |
|---|---|---|---|
| Open | Barragan Patricia | $105,000 | |
| Previous Owner | Simpson Miriam | $227,905 |
Source: Public Records
Tax History
| Year | Tax Paid | Tax Assessment Tax Assessment Total Assessment is a certain percentage of the fair market value that is determined by local assessors to be the total taxable value of land and additions on the property. | Land | Improvement |
|---|---|---|---|---|
| 2025 | $2,428 | $309,705 | -- | -- |
| 2024 | $2,428 | $296,945 | $0 | $0 |
| 2023 | $2,272 | $298,650 | $0 | $0 |
| 2022 | $2,354 | $299,750 | $0 | $0 |
| 2021 | $2,111 | $407,100 | $153,500 | $253,600 |
| 2020 | $1,960 | $371,400 | $122,800 | $248,600 |
| 2019 | $1,884 | $371,400 | $122,800 | $248,600 |
| 2018 | $1,784 | $336,000 | $115,800 | $220,200 |
| 2017 | $1,641 | $165,495 | $0 | $0 |
| 2016 | $1,595 | $148,390 | $0 | $0 |
| 2015 | $1,674 | $147,235 | $0 | $0 |
| 2014 | $1,668 | $146,080 | $0 | $0 |
Source: Public Records
Map
Nearby Homes
- 1916 N 430 W
- 127 S 400 E
- 1744 N 280 W
- 49 W 1880 N
- 240 E Center St
- 1547 N 275 West St Unit 5
- 14 N 850 E
- 1566 N 275 West St Unit 1
- 90 S 200 E
- 1548 N 275 West St Unit 2
- 229 E 60 N
- 701 E 215 N
- 133 Canal Dr
- 1461 N Amiron Way Unit B
- 1545 N State St Unit 1
- 1638 N 160 E
- 1636 N 160 E
- 332 W Amiron Way Unit D
- 120 N 950 E
- 271 N 400 E Unit 1
Your Personal Tour Guide
Ask me questions while you tour the home.