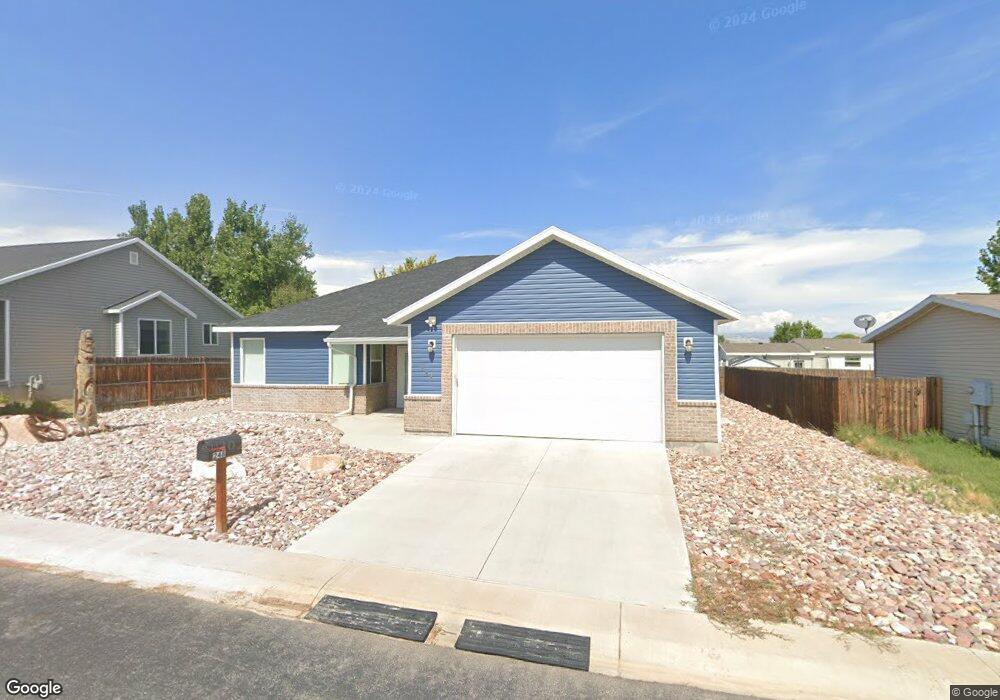
248 W 2100 S Unit 110 Vernal, UT 84078
Estimated Value: $289,000 - $344,812
3
Beds
2
Baths
1,333
Sq Ft
$233/Sq Ft
Est. Value
About This Home
This home is located at 248 W 2100 S Unit 110, Vernal, UT 84078 and is currently estimated at $311,203, approximately $233 per square foot. 248 W 2100 S Unit 110 is a home located in Uintah County with nearby schools including Discovery School, Vernal Middle School, and Uintah Middle School.
Ownership History
Date
Name
Owned For
Owner Type
Purchase Details
Closed on
May 18, 2020
Sold by
Sessions Lynda L
Bought by
Sessions Lynda L
Current Estimated Value
Home Financials for this Owner
Home Financials are based on the most recent Mortgage that was taken out on this home.
Original Mortgage
$102,500
Outstanding Balance
$90,829
Interest Rate
3.3%
Mortgage Type
New Conventional
Estimated Equity
$220,374
Purchase Details
Closed on
Aug 15, 2017
Sold by
Diversified Fund No 1 Llc
Bought by
Davis Charlie and Davis Cristy
Purchase Details
Closed on
Jul 31, 2009
Sold by
Rider & Quesenberry Llp
Bought by
Diversified Fund No 1 Llc
Home Financials for this Owner
Home Financials are based on the most recent Mortgage that was taken out on this home.
Original Mortgage
$10,000
Interest Rate
5.31%
Mortgage Type
Purchase Money Mortgage
Create a Home Valuation Report for This Property
The Home Valuation Report is an in-depth analysis detailing your home's value as well as a comparison with similar homes in the area
Home Values in the Area
Average Home Value in this Area
Purchase History
| Date | Buyer | Sale Price | Title Company |
|---|---|---|---|
| Sessions Lynda L | -- | None Available | |
| Davis Charlie | -- | Basin Land Title | |
| Diversified Fund No 1 Llc | -- | -- |
Source: Public Records
Mortgage History
| Date | Status | Borrower | Loan Amount |
|---|---|---|---|
| Open | Sessions Lynda L | $102,500 | |
| Previous Owner | Diversified Fund No 1 Llc | $10,000 |
Source: Public Records
Tax History Compared to Growth
Tax History
| Year | Tax Paid | Tax Assessment Tax Assessment Total Assessment is a certain percentage of the fair market value that is determined by local assessors to be the total taxable value of land and additions on the property. | Land | Improvement |
|---|---|---|---|---|
| 2024 | $1,343 | $159,749 | $9,310 | $150,439 |
| 2023 | $1,343 | $154,059 | $9,229 | $144,830 |
| 2022 | $1,291 | $125,093 | $9,229 | $115,864 |
| 2021 | $1,300 | $103,428 | $9,229 | $94,199 |
| 2020 | $1,266 | $103,428 | $9,229 | $94,199 |
| 2019 | $1,272 | $102,629 | $11,000 | $91,629 |
| 2018 | $247 | $20,000 | $20,000 | $0 |
| 2017 | $2 | $20,000 | $20,000 | $0 |
| 2016 | $225 | $20,000 | $20,000 | $0 |
| 2015 | $208 | $20,000 | $20,000 | $0 |
| 2014 | $205 | $20,000 | $20,000 | $0 |
| 2013 | $210 | $20,000 | $20,000 | $0 |
Source: Public Records
Map
Nearby Homes