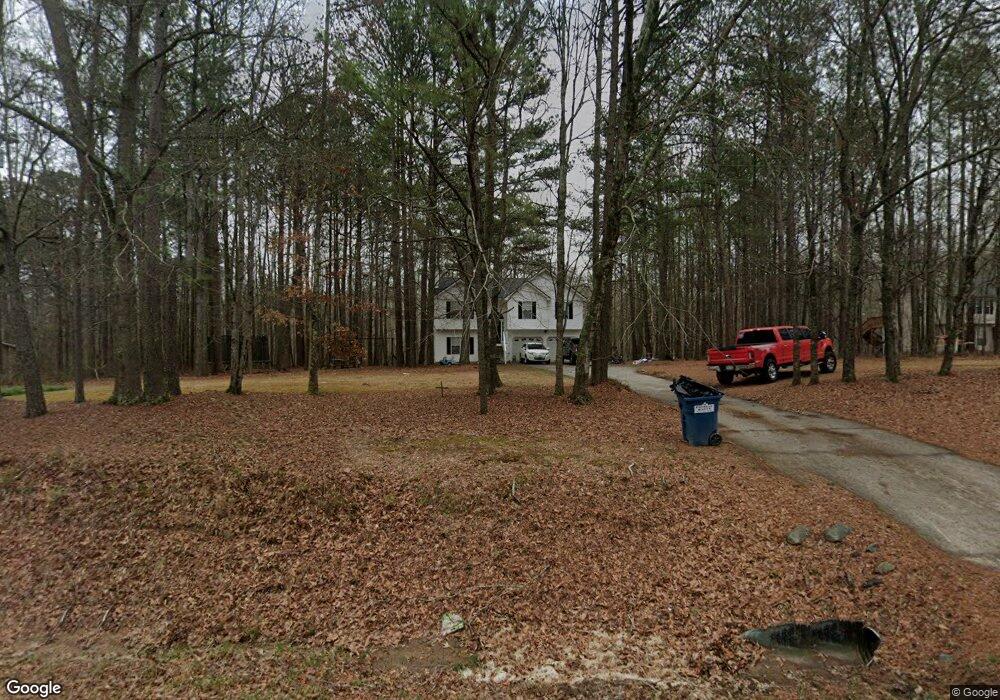
2481 N Highway 113 Temple, GA 30179
Estimated Value: $286,088 - $304,000
3
Beds
2
Baths
1,150
Sq Ft
$257/Sq Ft
Est. Value
About This Home
This home is located at 2481 N Highway 113, Temple, GA 30179 and is currently estimated at $295,522, approximately $256 per square foot. 2481 N Highway 113 is a home with nearby schools including Haralson County High School.
Ownership History
Date
Name
Owned For
Owner Type
Purchase Details
Closed on
Feb 20, 2015
Sold by
Thompson Keith E
Bought by
Prather Justin
Current Estimated Value
Home Financials for this Owner
Home Financials are based on the most recent Mortgage that was taken out on this home.
Original Mortgage
$108,061
Outstanding Balance
$82,705
Interest Rate
3.74%
Mortgage Type
New Conventional
Estimated Equity
$212,817
Purchase Details
Closed on
Apr 14, 2003
Sold by
S&T United Properties Inc
Bought by
Thompson Keith E and Thompson Sylvia
Purchase Details
Closed on
Dec 17, 2002
Sold by
Thompson Everette F and Thompson Keith E
Bought by
Tillman Mary J
Purchase Details
Closed on
Sep 30, 2002
Sold by
Thompson Everette F and Thompson Keith E
Bought by
S&T United Properties Inc
Purchase Details
Closed on
Feb 1, 2000
Sold by
Price Joseph O and Price Oth
Bought by
Spiva Spiva J and Spiva Wayne E
Purchase Details
Closed on
Mar 11, 1985
Bought by
Price Joseph O and Price Oth
Create a Home Valuation Report for This Property
The Home Valuation Report is an in-depth analysis detailing your home's value as well as a comparison with similar homes in the area
Home Values in the Area
Average Home Value in this Area
Purchase History
| Date | Buyer | Sale Price | Title Company |
|---|---|---|---|
| Prather Justin | $105,900 | -- | |
| Thompson Keith E | -- | -- | |
| Tillman Mary J | -- | -- | |
| S&T United Properties Inc | $16,000 | -- | |
| Thompson Everette F | $42,000 | -- | |
| Spiva Spiva J | -- | -- | |
| Spiva Spiva J | $123,000 | -- | |
| Price Joseph O | -- | -- |
Source: Public Records
Mortgage History
| Date | Status | Borrower | Loan Amount |
|---|---|---|---|
| Open | Prather Justin | $108,061 |
Source: Public Records
Tax History Compared to Growth
Tax History
| Year | Tax Paid | Tax Assessment Tax Assessment Total Assessment is a certain percentage of the fair market value that is determined by local assessors to be the total taxable value of land and additions on the property. | Land | Improvement |
|---|---|---|---|---|
| 2024 | $2,024 | $78,081 | $2,200 | $75,881 |
| 2023 | $1,994 | $74,377 | $2,024 | $72,353 |
| 2022 | $1,564 | $58,337 | $2,024 | $56,313 |
| 2021 | $1,343 | $48,069 | $1,965 | $46,104 |
| 2020 | $1,365 | $48,645 | $1,965 | $46,680 |
| 2019 | $1,348 | $46,261 | $1,965 | $44,296 |
| 2018 | $1,367 | $46,261 | $1,965 | $44,296 |
| 2017 | $1,350 | $41,500 | $1,965 | $39,535 |
| 2016 | $1,181 | $38,529 | $3,400 | $35,129 |
| 2015 | $1,176 | $38,363 | $3,400 | $34,964 |
| 2014 | $1,170 | $38,766 | $3,400 | $35,366 |
Source: Public Records
Map
Nearby Homes
- 2930 N Highway 113
- 2050 Georgia 113
- 1237 Morgan Rd
- 140 Suburban Dr
- 991 Waddell Rd
- 2895 Morgan Rd
- 300 Speight Rd
- 2475 Liberty Church Rd
- 329 Morgan Rd
- 191 True Gospel Rd
- 807 Old Draketown Pass
- 972 Seventh Court Ground Rd
- 0 Hutcheson Rd Unit 10474278
- 0 Hutcheson Rd Unit 7537190
- 658 Agan Rd
- 112 Brannon Rd
- 225 Hamrick Rd
- 3399 Corinth Poseyville Rd
- 3395 Cashtown Rd
- 489 Bethany Woods Dr
- 2465 N Highway 113
- 2465 Georgia 113
- 2415 N Highway 113
- 113 N Georgia Ave N
- 2445 N Highway 113
- 2536 N Highway 113
- 2432 N Highway 113
- 43 Spiva Spur
- 2197 N Highway 113
- 35 Spiva Spur
- 2576 N Highway 113
- 94 Spiva Rd
- 2508 N Highway 113
- 2356 N Highway 113
- 106 Spiva Rd
- 2651 N Highway 113
- 188 Spiva Rd
- 105 Spiva Rd
- 0 Spiva Rd
- 0 Spiva Rd Unit 7568977