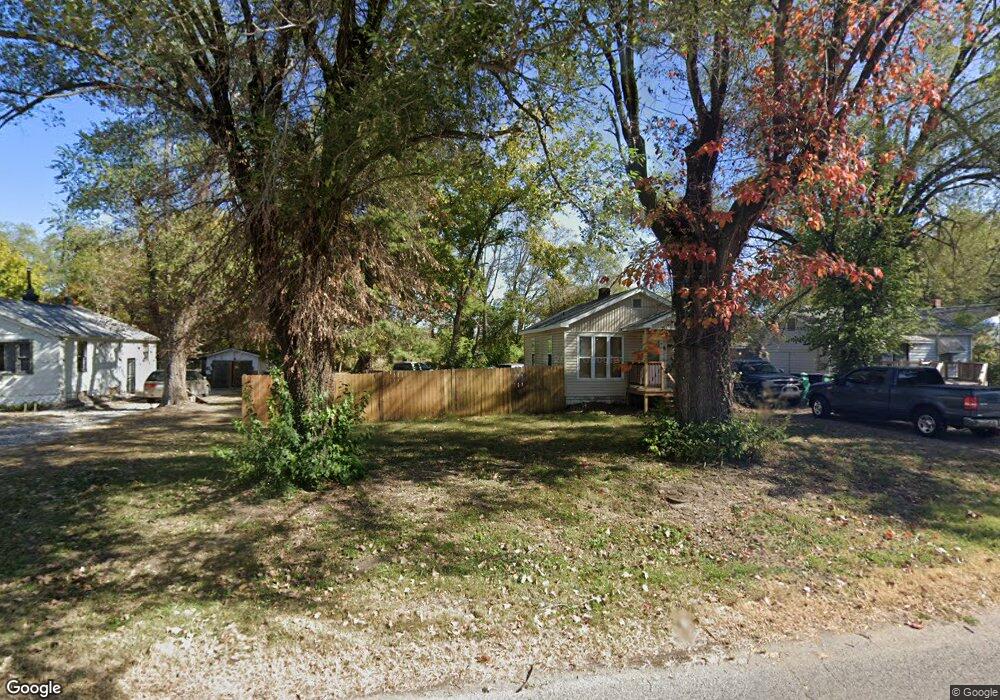
2481 Renois Ln East Saint Louis, IL 62206
Estimated Value: $42,000 - $79,000
--
Bed
--
Bath
624
Sq Ft
$89/Sq Ft
Est. Value
About This Home
This home is located at 2481 Renois Ln, East Saint Louis, IL 62206 and is currently estimated at $55,358, approximately $88 per square foot. 2481 Renois Ln is a home located in St. Clair County.
Ownership History
Date
Name
Owned For
Owner Type
Purchase Details
Closed on
Dec 13, 2021
Sold by
St Clair County
Bought by
Berryman Louis
Current Estimated Value
Purchase Details
Closed on
Apr 6, 2017
Sold by
Saint Clair County
Bought by
Johnson Janise L
Purchase Details
Closed on
Jul 25, 2016
Sold by
Brown Sonya
Bought by
County Of Saint Clair
Purchase Details
Closed on
Dec 4, 2003
Sold by
Arrow Realty Inc
Bought by
Brown Sonya
Home Financials for this Owner
Home Financials are based on the most recent Mortgage that was taken out on this home.
Original Mortgage
$30,000
Interest Rate
6.01%
Mortgage Type
Purchase Money Mortgage
Purchase Details
Closed on
Mar 19, 2001
Sold by
Wachter Ferdinand Frank
Bought by
Arrow Realty Inc
Create a Home Valuation Report for This Property
The Home Valuation Report is an in-depth analysis detailing your home's value as well as a comparison with similar homes in the area
Home Values in the Area
Average Home Value in this Area
Purchase History
| Date | Buyer | Sale Price | Title Company |
|---|---|---|---|
| Berryman Louis | -- | Attorney | |
| Johnson Janise L | -- | Attorney | |
| County Of Saint Clair | -- | Attorney | |
| Brown Sonya | $20,000 | -- | |
| Arrow Realty Inc | $7,000 | -- |
Source: Public Records
Mortgage History
| Date | Status | Borrower | Loan Amount |
|---|---|---|---|
| Previous Owner | Brown Sonya | $30,000 |
Source: Public Records
Tax History Compared to Growth
Tax History
| Year | Tax Paid | Tax Assessment Tax Assessment Total Assessment is a certain percentage of the fair market value that is determined by local assessors to be the total taxable value of land and additions on the property. | Land | Improvement |
|---|---|---|---|---|
| 2024 | $716 | $4,803 | $1,040 | $3,763 |
| 2023 | $852 | $5,748 | $940 | $4,808 |
| 2022 | $119 | $824 | $824 | $0 |
| 2021 | $0 | $102 | $51 | $51 |
| 2020 | $901 | $5,417 | $818 | $4,599 |
| 2019 | $935 | $5,417 | $818 | $4,599 |
| 2018 | $945 | $5,496 | $830 | $4,666 |
| 2017 | $900 | $5,364 | $810 | $4,554 |
| 2016 | $0 | $5,345 | $808 | $4,537 |
| 2014 | $816 | $5,287 | $799 | $4,488 |
| 2013 | $794 | $4,959 | $749 | $4,210 |
Source: Public Records
Map
Nearby Homes