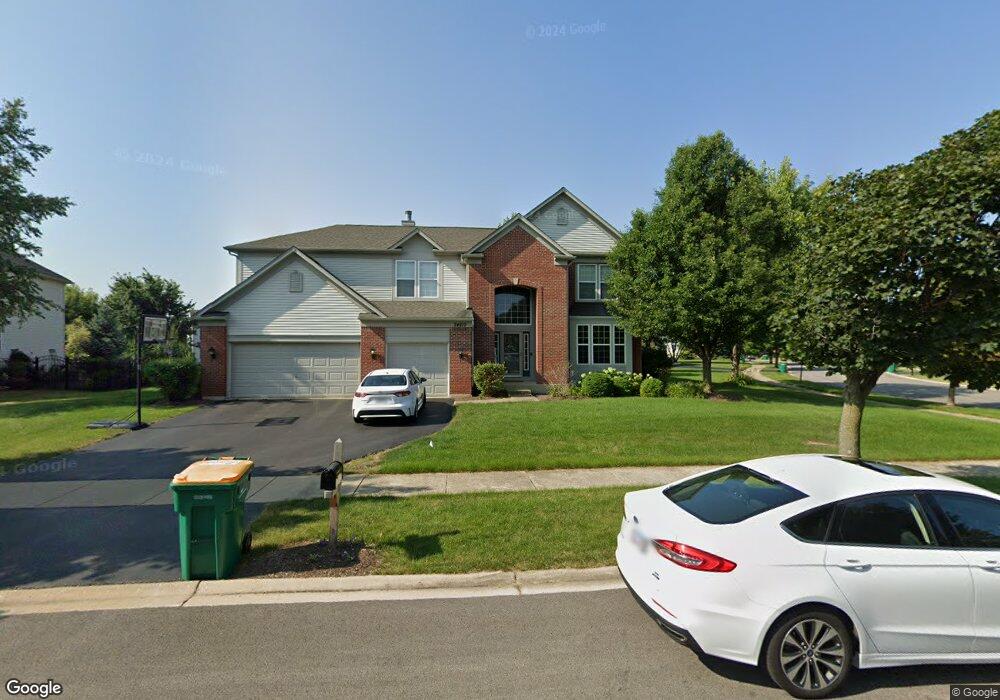
24819 Station St Plainfield, IL 60585
Estimated Value: $616,000 - $663,000
4
Beds
3
Baths
3,533
Sq Ft
$182/Sq Ft
Est. Value
About This Home
This home is located at 24819 Station St, Plainfield, IL 60585 and is currently estimated at $644,243, approximately $182 per square foot. 24819 Station St is a home located in Will County with nearby schools including Freedom Elementary School, Heritage Grove Middle School, and Plainfield North High School.
Ownership History
Date
Name
Owned For
Owner Type
Purchase Details
Closed on
Feb 18, 2010
Sold by
Letcher Mark
Bought by
Letcher Mark and Letcher Georgia J
Current Estimated Value
Purchase Details
Closed on
Dec 31, 2009
Sold by
Aurora Loan Services Llc
Bought by
Letcher Mark D
Purchase Details
Closed on
Oct 2, 2009
Sold by
Andres Veronica and Case #08 Ch 4989
Bought by
Aurora Loan Services Llc
Purchase Details
Closed on
Aug 5, 2009
Sold by
Andres Veronica and Huerta Jose
Bought by
Aurora Loan Services Llc
Purchase Details
Closed on
Dec 28, 2005
Sold by
Pulte Homes
Bought by
Huerta Jose and Andres Veronica
Home Financials for this Owner
Home Financials are based on the most recent Mortgage that was taken out on this home.
Original Mortgage
$397,100
Interest Rate
6.46%
Mortgage Type
Fannie Mae Freddie Mac
Create a Home Valuation Report for This Property
The Home Valuation Report is an in-depth analysis detailing your home's value as well as a comparison with similar homes in the area
Home Values in the Area
Average Home Value in this Area
Purchase History
| Date | Buyer | Sale Price | Title Company |
|---|---|---|---|
| Letcher Mark | -- | None Available | |
| Letcher Mark D | $297,000 | Parks Title | |
| Aurora Loan Services Llc | -- | None Available | |
| Aurora Loan Services Llc | $491,227 | None Available | |
| Huerta Jose | $418,000 | None Available |
Source: Public Records
Mortgage History
| Date | Status | Borrower | Loan Amount |
|---|---|---|---|
| Previous Owner | Huerta Jose | $397,100 |
Source: Public Records
Tax History Compared to Growth
Tax History
| Year | Tax Paid | Tax Assessment Tax Assessment Total Assessment is a certain percentage of the fair market value that is determined by local assessors to be the total taxable value of land and additions on the property. | Land | Improvement |
|---|---|---|---|---|
| 2024 | $13,237 | $189,886 | $37,269 | $152,617 |
| 2023 | $13,237 | $167,744 | $32,923 | $134,821 |
| 2022 | $11,151 | $145,141 | $31,145 | $113,996 |
| 2021 | $10,743 | $138,230 | $29,662 | $108,568 |
| 2020 | $10,736 | $136,040 | $29,192 | $106,848 |
| 2019 | $10,576 | $132,206 | $28,369 | $103,837 |
| 2018 | $9,162 | $113,135 | $27,745 | $85,390 |
| 2017 | $8,854 | $110,215 | $27,029 | $83,186 |
| 2016 | $8,869 | $107,842 | $26,447 | $81,395 |
| 2015 | $8,819 | $103,694 | $25,430 | $78,264 |
| 2014 | $8,819 | $103,694 | $25,430 | $78,264 |
| 2013 | $8,819 | $100,710 | $25,430 | $75,280 |
Source: Public Records
Map
Nearby Homes
- 12206 Red Clover Ln
- 12136 Winterberry Ln
- 12906 S Sydney Cir
- 12116 Winterberry Ln
- 25022 Steeple Chase Dr
- 11900 Winterberry Ln
- 12805 Tipperary Ln
- 24634 W Alexis Ln
- 24638 W Alexis Ln
- 24618 W Alexis Ln
- 25212 Trelliage Ave
- 12820 Tipperary Ln
- 24558 W Alexis Ln
- 24708 W Owen Ct
- 25205 Pastoral Dr
- 70AC W 119th St
- 24806 Gates Ct Unit 215A
- 12262 White Oak Dr
- 12850 S Harry Cir
- 12946 S Sydney Cir
- 24815 Station St
- 24902 Blue Iris Ct N
- 24828 Blue Iris Ct N
- 24906 Blue Iris Ct N
- 12312 Blue Iris Ln
- 12308 Blue Iris Ln
- 24811 Station St
- 24910 Blue Iris Ct N
- 24908 Blue Iris Ct N
- 24812 Station St
- 12316 Blue Iris Ln
- 24824 Blue Iris Ct N
- 12305 Blue Iris Ln
- 12304 Blue Iris Ln
- 12320 Blue Iris Ln
- 12300 Blue Iris Ln
- 24820 Blue Iris Ct N
- 12301 Blue Iris Ln
- 12324 Blue Iris Ln
- 24905 Blue Iris Ct N