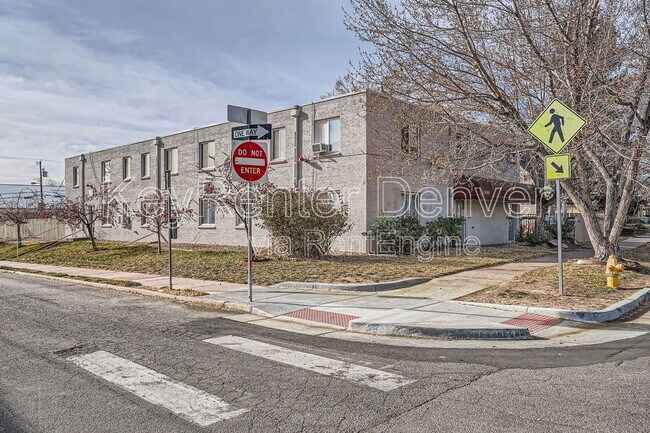
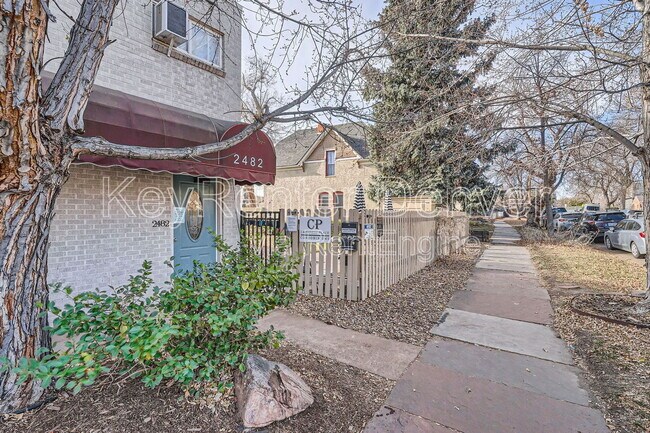
2482 W Caithness Place Unit 11 Denver, CO 80211
Highland NeighborhoodAbout This Home
Apply now:
Mid Term Stay - Minimum 30 Day Stays ; Maximum 11 Month Stays
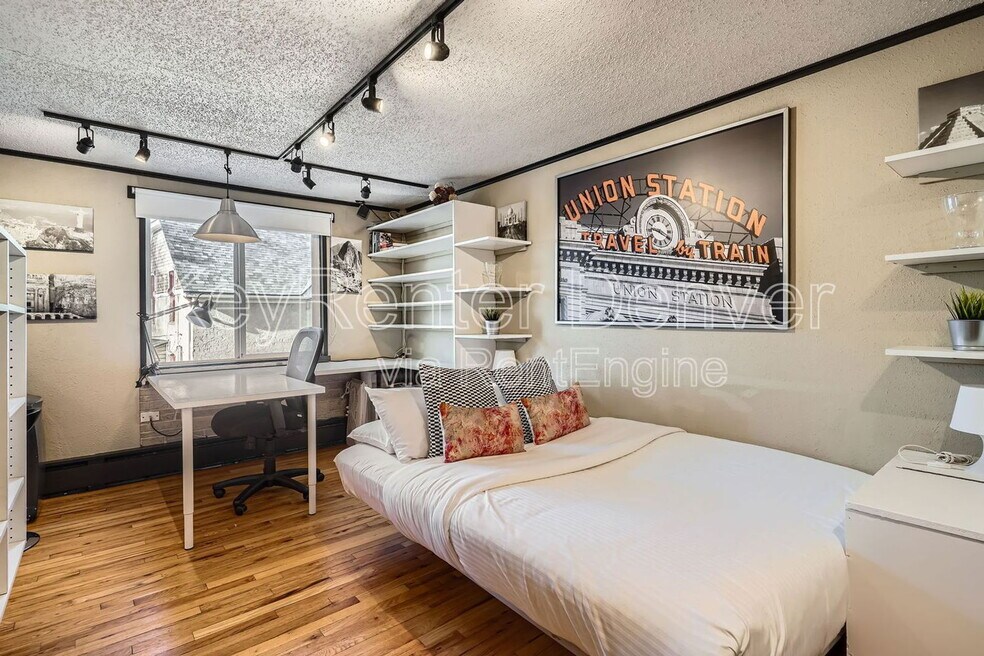
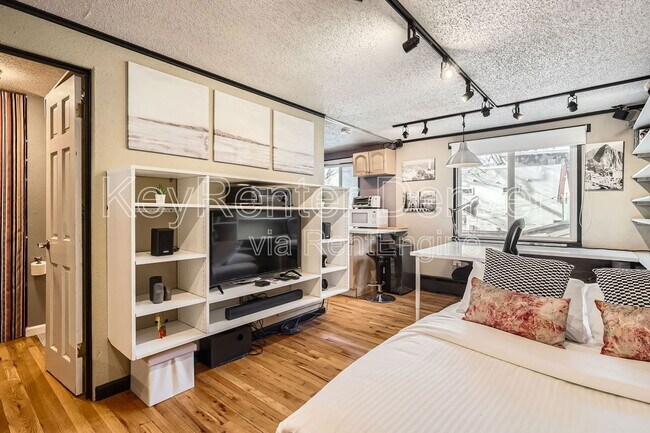
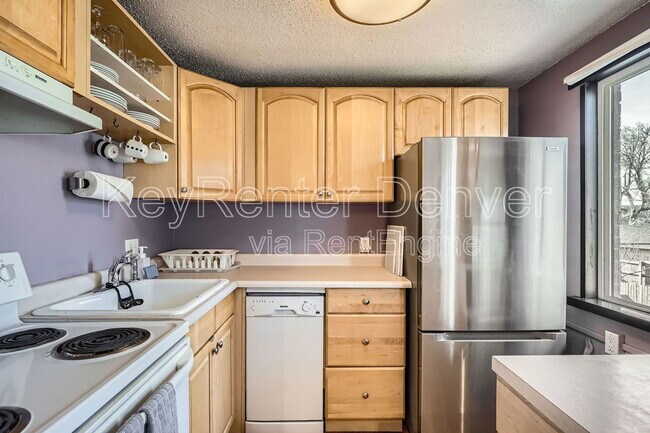
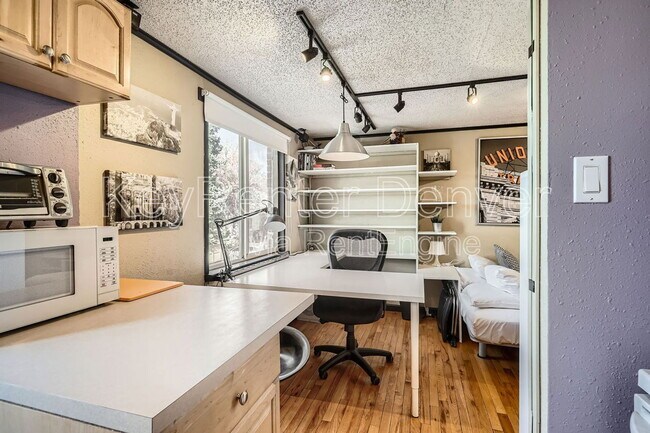
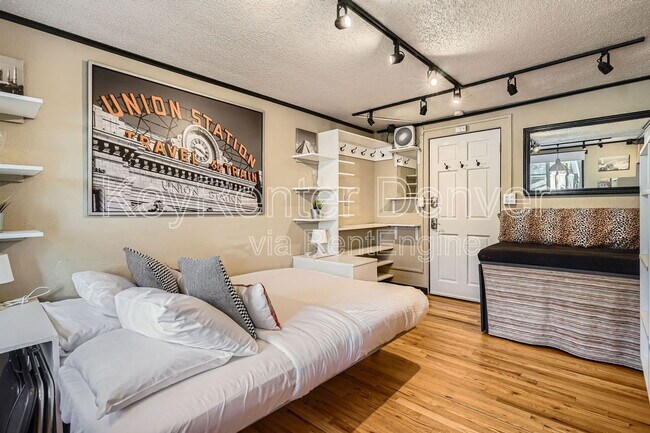
This top-floor, 400 sqft loft-like studio combines thoughtful design with comfort and efficiency in Denver’s vibrant Lower Highlands (LoHi) neighborhood. The space features a queen sofa bed with an 8" memory foam mattress, a versatile L-shaped desk/dining table, a full kitchen, and a modern bathroom with a rain shower. Amenities include a 40" HDTV with surround sound, portable AC, an in-unit washing machine, ample storage, keyless entry, and WiFi. Nestled on a quiet, tree-lined street in the Scottish Highlands, the location offers easy access to LoHi’s coffee shops, bars, restaurants, and boutique shops, as well as public transit, Speer Boulevard, I-25, and I-70. Just steps from the Ashland Recreation Center, yoga studios, and 1/2 mile from Confluence Park and bike trails, it’s perfect for enjoying both urban convenience and outdoor exploration.
Head to to submit your application!
PET POLICY:
*ONLY 1 Pet Allowed per HOA
*Pets Accepted
*Pet Deposit: $300
*Pet Rent: $35
UTILITY POLICY:
*All utilities included
MOVE IN COSTS:
*Refundable Security Deposit: $500
*Refundable Pet Deposit: $300
*Cleaning Fee: $300
*Lease Initiation Fee: $250
LEASING INFORMATION:
Listing Representative: Misty Castillo, misty@
Guest Must Sign Lease Before Booking
- 30-day minimum
- All Guest over 18 must sign
- Lease is per Colorado State Law
Denver Rental License: 2023-BFN-0025741
Keyrenter Denver
4300 N Harlan St. Wheat Ridge, CO 80033
Rental License Number 2023-BFN-0025741
By submitting your information on this page you consent to being contacted by the Property Manager and RentEngine via SMS, phone, or email.

Map
- 2480 W Caithness Place Unit 2
- 2441 W Caithness Place
- 2600 W Argyle Place
- 3040 Zuni St Unit 7
- 2460 W 29th Ave Unit 406
- 2460 W 29th Ave Unit 404
- 3211 Zuni St Unit 9
- 3244 Clay St
- 2731 W 32nd Ave
- 2880 Zuni St Unit 309
- 2880 Zuni St Unit 408
- 2880 Zuni St Unit 404
- 2880 Zuni St Unit 303
- 2880 Zuni St Unit 308
- 2729 W 28th Ave Unit 407
- 2900 Wyandot St Unit 101
- 2752 Clay St Unit 404
- 2733 W 28th Ave Unit 8
- 2825 Wyandot St
- 2736 Clay St
- 2482 W Caithness Place Unit 14
- 2424-2434 W Caithness Place
- 2629 W 32nd Ave
- 2600 W 29th Ave Unit B
- 2635 W 33rd Ave
- 3102 Wyandot St
- 2828 Zuni St
- 3111 Vallejo St
- 2729 W 28th Ave
- 2729 W 28th Ave Unit Jeff park Flats
- 2955 Vallejo St
- 2215 W 32nd Ave
- 2785 N Speer Blvd
- 2920 W 32nd Ave
- 2700 Decatur St
- 2298 W 28th Ave
- 2915 Umatilla St
- 3233 Eliot St
- 2424 W 35th Ave Unit 3
- 3295 Eliot St