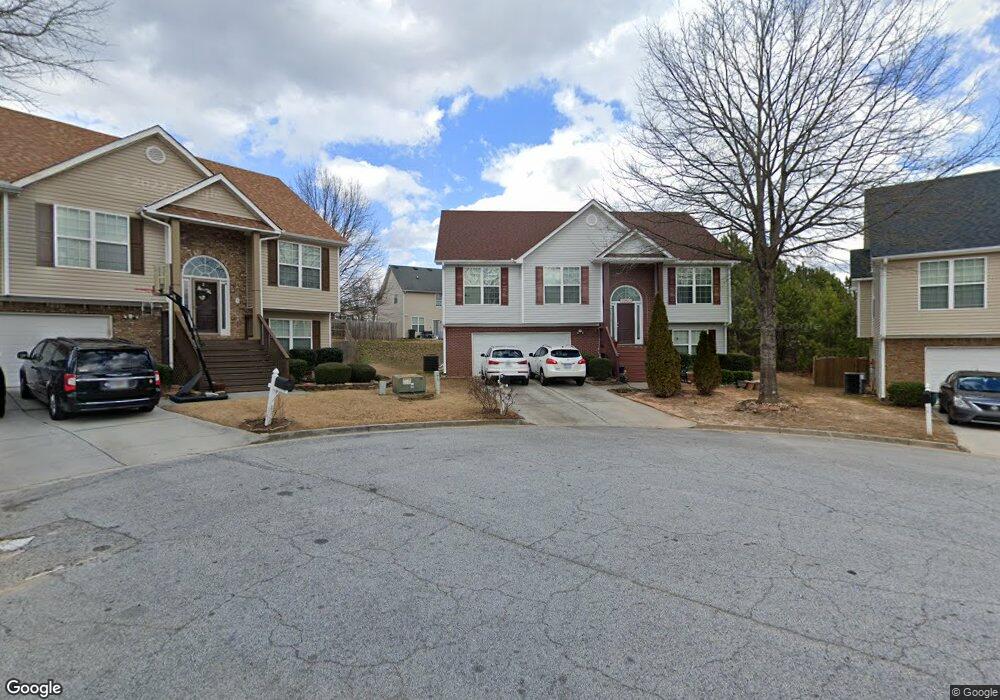
2483 Temple View Dr Snellville, GA 30078
Estimated Value: $357,000 - $421,000
5
Beds
3
Baths
2,706
Sq Ft
$142/Sq Ft
Est. Value
About This Home
This home is located at 2483 Temple View Dr, Snellville, GA 30078 and is currently estimated at $383,803, approximately $141 per square foot. 2483 Temple View Dr is a home located in Gwinnett County with nearby schools including Norton Elementary School, Snellville Middle School, and South Gwinnett High School.
Ownership History
Date
Name
Owned For
Owner Type
Purchase Details
Closed on
Jul 1, 2025
Sold by
Vosoq Samir
Bought by
Nazima Sharzad and Ahmed Vosoq Ahmed
Current Estimated Value
Purchase Details
Closed on
May 7, 2021
Sold by
Vosoq Samir
Bought by
Vosoq Samir and Vosoq Ahmed Soheyl
Purchase Details
Closed on
Jan 9, 2017
Sold by
Vosoq Mohammad
Bought by
Vosoq Siyeer and Vosoq Samir
Home Financials for this Owner
Home Financials are based on the most recent Mortgage that was taken out on this home.
Original Mortgage
$186,558
Interest Rate
4.13%
Mortgage Type
FHA
Purchase Details
Closed on
Feb 24, 2006
Sold by
Presidio Homes Llc
Bought by
Vosoq Mohammad and Sharzad Nazima
Home Financials for this Owner
Home Financials are based on the most recent Mortgage that was taken out on this home.
Original Mortgage
$178,805
Interest Rate
6.04%
Mortgage Type
New Conventional
Create a Home Valuation Report for This Property
The Home Valuation Report is an in-depth analysis detailing your home's value as well as a comparison with similar homes in the area
Home Values in the Area
Average Home Value in this Area
Purchase History
| Date | Buyer | Sale Price | Title Company |
|---|---|---|---|
| Nazima Sharzad | -- | -- | |
| Vosoq Samir | -- | -- | |
| Vosoq Siyeer | $190,000 | -- | |
| Vosoq Mohammad | $178,900 | -- |
Source: Public Records
Mortgage History
| Date | Status | Borrower | Loan Amount |
|---|---|---|---|
| Previous Owner | Vosoq Siyeer | $186,558 | |
| Previous Owner | Vosoq Mohammad | $178,805 |
Source: Public Records
Tax History Compared to Growth
Tax History
| Year | Tax Paid | Tax Assessment Tax Assessment Total Assessment is a certain percentage of the fair market value that is determined by local assessors to be the total taxable value of land and additions on the property. | Land | Improvement |
|---|---|---|---|---|
| 2024 | $5,868 | $155,480 | $30,000 | $125,480 |
| 2023 | $5,868 | $158,680 | $29,680 | $129,000 |
| 2022 | $4,885 | $128,720 | $20,000 | $108,720 |
| 2021 | $4,017 | $102,680 | $16,000 | $86,680 |
| 2020 | $3,574 | $89,840 | $14,000 | $75,840 |
| 2019 | $3,444 | $89,840 | $14,000 | $75,840 |
| 2018 | $3,054 | $78,800 | $12,000 | $66,800 |
| 2016 | $2,389 | $65,200 | $8,800 | $56,400 |
| 2015 | $2,119 | $56,880 | $8,800 | $48,080 |
| 2014 | $2,129 | $56,880 | $8,800 | $48,080 |
Source: Public Records
Map
Nearby Homes
- 2289 Pate Brook Rd
- 3206 Pate Creek View
- 3276 Pate Creek View
- 2433 Hidden Ln
- 3186 Laurel Way
- 3491 Skyland Ridge Ct
- 3190 Grand Central Dr
- 3127 Hidden Forest Dr
- 2405 Ivy Way
- 3630 Millers Pond Way SW
- 2523 Meadowbrook Way
- 2050 Lyda Ln
- 3054 Periwinkle Dr Unit 2
- 3079 Lenora Church Rd
- 3414 Preserve Run Trail Unit 5
- 2136 Briarwood Ct
- 3720 Millers Pond Way SW
- 2280 Village Centre Dr Unit 1
- 2473 Temple View Dr Unit 3
- 2493 Temple View Dr Unit 3
- 2378 Pate Brook Rd Unit 2
- 2388 Pate Brook Rd
- 2368 Pate Brook Rd
- 2398 Pate Brook Rd
- 2423 Temple View Dr
- 2482 Temple View Dr
- 2472 Temple View Dr
- 2472 Temple View Dr Unit 3
- 2403 Temple View Dr Unit 3
- 2358 Pate Brook Rd
- 2408 Pate Brook Rd Unit 2
- 2462 Temple View Dr Unit 3
- 0 Pate Brook Rd Unit 7264941
- 0 Pate Brook Rd Unit 8345847
- 0 Pate Brook Rd Unit 7275382
- 0 Pate Brook Rd Unit 7250868
- 0 Pate Brook Rd Unit 7178188
- 0 Pate Brook Rd Unit 3204136