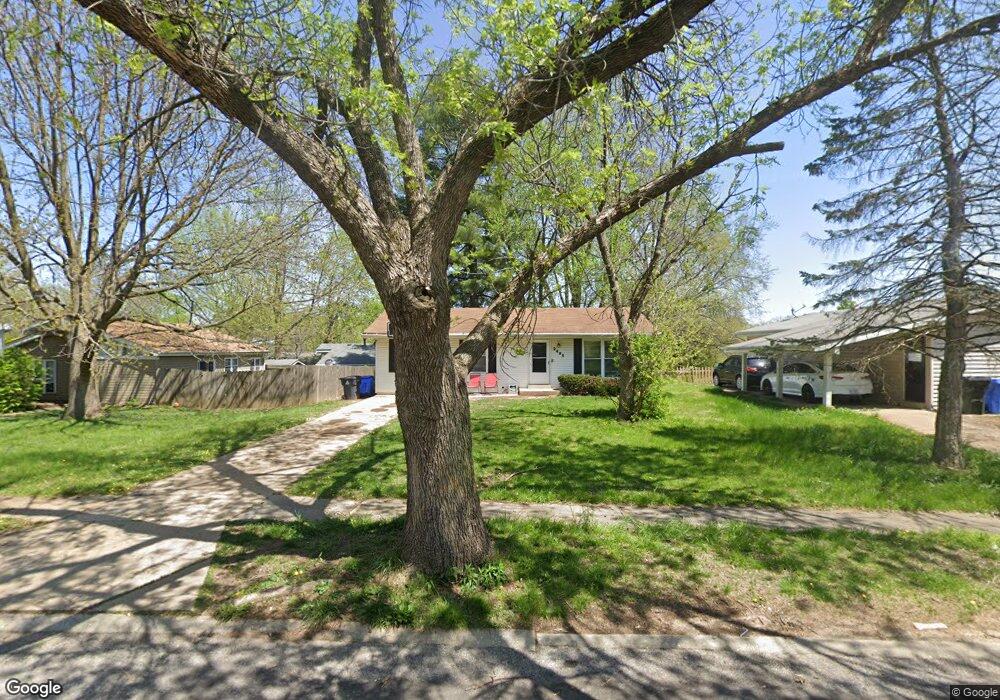
2485 Jenkee Dr Florissant, MO 63031
Estimated Value: $91,000 - $183,000
3
Beds
1
Bath
960
Sq Ft
$155/Sq Ft
Est. Value
About This Home
This home is located at 2485 Jenkee Dr, Florissant, MO 63031 and is currently estimated at $149,031, approximately $155 per square foot. 2485 Jenkee Dr is a home located in St. Louis County with nearby schools including Lawson Elementary School, West Middle School, and Hazelwood West High School.
Ownership History
Date
Name
Owned For
Owner Type
Purchase Details
Closed on
Aug 15, 2013
Sold by
Secretary Of Housing & Urban Development
Bought by
Bltrejv3 St Louis Llc
Current Estimated Value
Purchase Details
Closed on
Dec 13, 2012
Sold by
Bank Of America Na
Bought by
Secretary Of Housing & Urban Development
Purchase Details
Closed on
Nov 30, 2012
Sold by
Jenkins Patricia
Bought by
Bank Of America Na
Purchase Details
Closed on
Feb 18, 2012
Sold by
Community Improvement Company Llc
Bought by
Jenkins Patricia M
Purchase Details
Closed on
Nov 25, 2006
Sold by
Jenkins Patricia M
Bought by
Community Improvement Co Llc
Purchase Details
Closed on
Jul 19, 2002
Sold by
Trulaske James and Trulaske Kimberly
Bought by
Jenkins Patricia
Home Financials for this Owner
Home Financials are based on the most recent Mortgage that was taken out on this home.
Original Mortgage
$84,245
Interest Rate
6.69%
Mortgage Type
FHA
Create a Home Valuation Report for This Property
The Home Valuation Report is an in-depth analysis detailing your home's value as well as a comparison with similar homes in the area
Home Values in the Area
Average Home Value in this Area
Purchase History
| Date | Buyer | Sale Price | Title Company |
|---|---|---|---|
| Bltrejv3 St Louis Llc | $45,000 | None Available | |
| Secretary Of Housing & Urban Development | $75,501 | None Available | |
| Bank Of America Na | $95,820 | None Available | |
| Jenkins Patricia M | -- | None Available | |
| Community Improvement Co Llc | $84,002 | None Available | |
| Jenkins Patricia | $85,000 | -- |
Source: Public Records
Mortgage History
| Date | Status | Borrower | Loan Amount |
|---|---|---|---|
| Previous Owner | Jenkins Patricia | $84,245 | |
| Closed | Community Improvement Co Llc | -- |
Source: Public Records
Tax History Compared to Growth
Tax History
| Year | Tax Paid | Tax Assessment Tax Assessment Total Assessment is a certain percentage of the fair market value that is determined by local assessors to be the total taxable value of land and additions on the property. | Land | Improvement |
|---|---|---|---|---|
| 2025 | $1,939 | $24,610 | $4,280 | $20,330 |
| 2024 | $1,939 | $21,550 | $2,870 | $18,680 |
| 2023 | $1,937 | $21,550 | $2,870 | $18,680 |
| 2022 | $1,776 | $17,600 | $3,290 | $14,310 |
| 2021 | $1,731 | $17,600 | $3,290 | $14,310 |
| 2020 | $1,530 | $14,650 | $2,870 | $11,780 |
| 2019 | $1,507 | $14,650 | $2,870 | $11,780 |
| 2018 | $1,386 | $12,370 | $2,340 | $10,030 |
| 2017 | $1,384 | $12,370 | $2,340 | $10,030 |
| 2016 | $1,203 | $10,570 | $2,340 | $8,230 |
| 2015 | $1,178 | $10,570 | $2,340 | $8,230 |
| 2014 | $1,143 | $10,570 | $2,130 | $8,440 |
Source: Public Records
Map
Nearby Homes
- 2484 Blue Heron Dr
- 2487 Manthorne Ct
- 2620 Lindsay Ln
- 2 Aspen II at Koch Park Manors
- 2 Belmont at River Bluffs Meadows
- 282 Noser Dr
- 2 Carolina at River Bluffs Meadows
- 2 Fieldcrest at River Bluffs Meadows
- 275 Noser Dr
- 2 Maple at Koch Park Manors
- 2165 Jenkee Dr
- 2 Aspen at River Bluffs Manors Unit Aspen at River Bluff
- 2 Royal II at Koch Park Manors
- 2 Sterling at River Bluffs Manors
- 2 Sterling at Koch Park Manors
- 2 Aspen II at River Bluffs Manors
- 2321 Fernau Ct
- 2317 Fernau Ct
- 2 Aspen at Koch Park Manors
- 2 Royal II at River Bluffs Manors
- 2475 Jenkee Dr
- 2495 Jenkee Dr
- 2465 Jenkee Dr
- 2474 Blue Heron Dr
- 0 Blue Heron Dr
- 2480 Jenkee Dr
- 2470 Jenkee Dr
- 2524 Blue Heron Dr
- 2464 Blue Heron Dr
- 2460 Jenkee Dr
- 2445 Jenkee Dr
- 2454 Blue Heron Dr
- 2493 Blue Heron Dr
- 2505 Blue Heron Dr
- 2483 Blue Heron Dr
- 2450 Jenkee Dr
- 2515 Blue Heron Dr
- 2435 Jenkee Dr
- 2473 Blue Heron Dr
- 2525 Blue Heron Dr