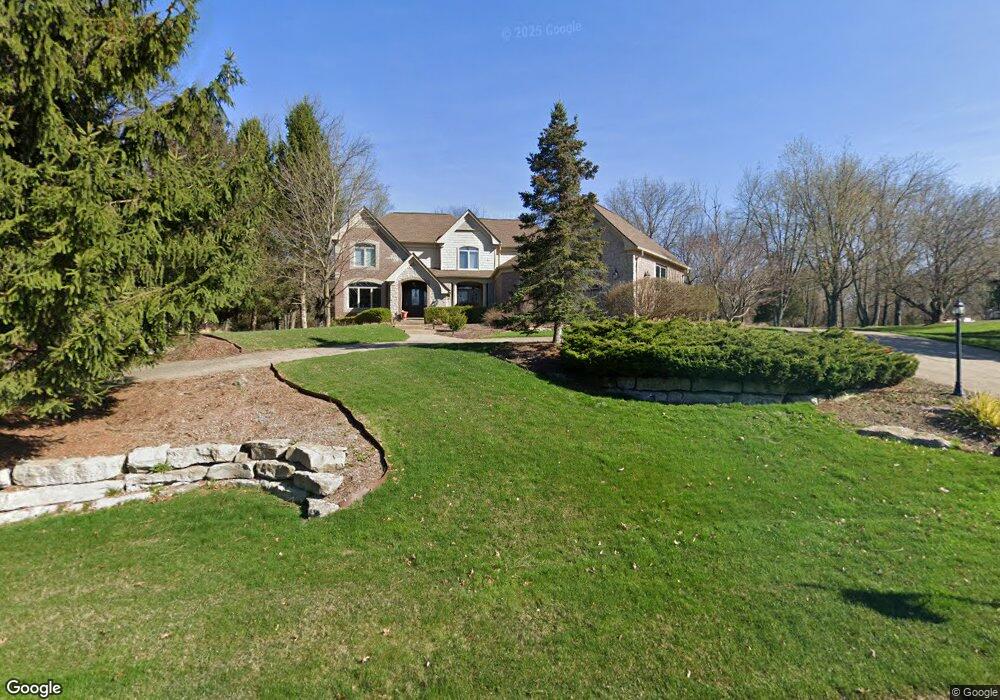
2486 Overbrook Unit Bldg-Unit Highland, MI 48357
Estimated Value: $824,891 - $889,000
4
Beds
5
Baths
3,577
Sq Ft
$240/Sq Ft
Est. Value
About This Home
This home is located at 2486 Overbrook Unit Bldg-Unit, Highland, MI 48357 and is currently estimated at $860,223, approximately $240 per square foot. 2486 Overbrook Unit Bldg-Unit is a home located in Oakland County with nearby schools including Highland Elementary School, Muir Middle School, and Our Savior Evangelical Lutheran School.
Ownership History
Date
Name
Owned For
Owner Type
Purchase Details
Closed on
Aug 10, 2018
Sold by
Alarie Robert C and Alarie Nicole A
Bought by
Peck Bruce M and Peck Wendy L
Current Estimated Value
Purchase Details
Closed on
Mar 31, 2016
Sold by
Tauriainen Steven J and Tauriainen Marvat F
Bought by
Alarie Robert C and Alarie Nicole A
Home Financials for this Owner
Home Financials are based on the most recent Mortgage that was taken out on this home.
Original Mortgage
$340,000
Interest Rate
2.87%
Mortgage Type
Adjustable Rate Mortgage/ARM
Purchase Details
Closed on
Oct 18, 2000
Sold by
Hickory Highland Dev Cor
Bought by
Wyborski Alfred
Create a Home Valuation Report for This Property
The Home Valuation Report is an in-depth analysis detailing your home's value as well as a comparison with similar homes in the area
Home Values in the Area
Average Home Value in this Area
Purchase History
| Date | Buyer | Sale Price | Title Company |
|---|---|---|---|
| Peck Bruce M | $545,000 | Fidelity National Title | |
| Alarie Robert C | $492,000 | First American Title Ins Co | |
| Wyborski Alfred | -- | -- |
Source: Public Records
Mortgage History
| Date | Status | Borrower | Loan Amount |
|---|---|---|---|
| Previous Owner | Alarie Robert C | $340,000 |
Source: Public Records
Tax History Compared to Growth
Tax History
| Year | Tax Paid | Tax Assessment Tax Assessment Total Assessment is a certain percentage of the fair market value that is determined by local assessors to be the total taxable value of land and additions on the property. | Land | Improvement |
|---|---|---|---|---|
| 2024 | $6,921 | $364,230 | $0 | $0 |
| 2023 | $6,602 | $325,830 | $0 | $0 |
| 2022 | $9,126 | $296,010 | $0 | $0 |
| 2021 | $8,628 | $282,820 | $0 | $0 |
| 2020 | $6,045 | $275,940 | $0 | $0 |
| 2019 | $8,389 | $261,670 | $0 | $0 |
| 2018 | $8,273 | $254,300 | $0 | $0 |
| 2017 | $7,991 | $254,300 | $0 | $0 |
| 2016 | $6,376 | $246,900 | $0 | $0 |
| 2015 | -- | $233,730 | $0 | $0 |
| 2014 | -- | $217,320 | $0 | $0 |
| 2011 | -- | $185,000 | $0 | $0 |
Source: Public Records
Map
Nearby Homes
- 2358 Canterwood
- 2836 Pine Bluffs Ct
- 2423 Canterwood
- 2323 Canterwood
- 78 Elm Unit 78
- 53 Ash Ave Unit 53
- 1449 Gleneagles Unit 257
- 234 Maple Unit 234
- 200 Birch Unit 200
- 212 Maple Unit 212
- 83 Elm
- 203 Birch Unit 203
- 1569 Gleneagles
- 248 Spruce Unit 248
- 1570 Lone Tree Rd
- 274 Carnoustie Unit 211
- 297 Gleneagles Unit 213
- 839 Harlequin Ct
- 3071 Allison Ln Unit 5
- 398 Delmar Ct
- 2486 Overbrook
- 2518 Overbrook
- 2454 Overbrook Unit 26
- 2495 Overbrook
- 2459 Overbrook Unit 37
- 2552 Overbrook
- 2420 Overbrook Unit 27
- 2527 Overbrook Unit 39
- 2425 Overbrook
- 2485 Canterwood Unit 16
- 2455 Canterwood
- 0 Overbrook Unit 214084664
- 0 Overbrook Unit R214124027
- 0 Overbrook Unit R2200094528
- 0 Overbrook Unit R2200084734
- 0 Overbrook Unit R2210007094
- 0 Overbrook Unit R2220005218
- 0 Overbrook Unit R2210007189
- 0 Overbrook Unit R2210057696
- 2262 Overbrook