Estimated Value: $467,070 - $536,000
3
Beds
2
Baths
2,406
Sq Ft
$207/Sq Ft
Est. Value
About This Home
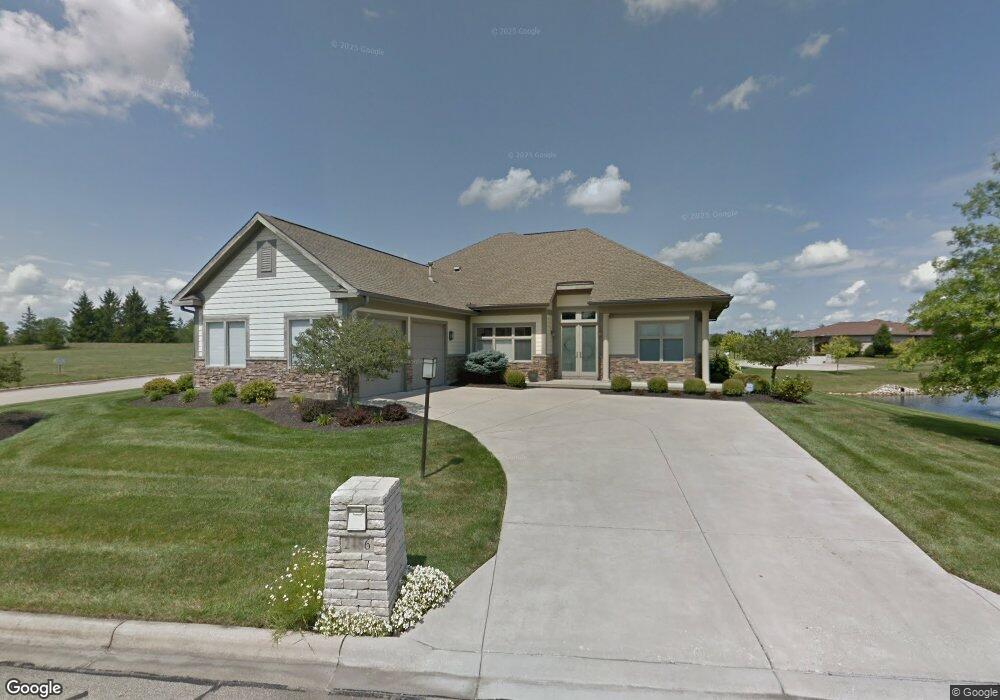
This home is located at 2486 Sherbourne Way, Xenia, OH 45385 and is currently estimated at $498,518, approximately $207 per square foot. 2486 Sherbourne Way is a home located in Greene County with nearby schools including Trebein Elementary School, Jacob Coy Middle School, and Beavercreek High School.
Ownership History
Date
Name
Owned For
Owner Type
Purchase Details
Closed on
Mar 19, 2024
Sold by
Wallman Justin B and Wallman Sarah L
Bought by
Wallman Joint Revocable Living Trust and Wallman
Current Estimated Value
Purchase Details
Closed on
Apr 12, 2007
Sold by
Pund Douglas and Pund Melody S
Bought by
Pund Douglas A
Home Financials for this Owner
Home Financials are based on the most recent Mortgage that was taken out on this home.
Original Mortgage
$342,400
Interest Rate
5.87%
Mortgage Type
Unknown
Purchase Details
Closed on
Jul 26, 2005
Sold by
Capital Golf Management Llc
Bought by
Millennium Fine Homes Llc
Purchase Details
Closed on
Jul 28, 2004
Sold by
Millennium Fine Homes Llc
Bought by
Pund Douglas and Pund Melody S
Home Financials for this Owner
Home Financials are based on the most recent Mortgage that was taken out on this home.
Original Mortgage
$382,914
Interest Rate
5.5%
Mortgage Type
Fannie Mae Freddie Mac
Create a Home Valuation Report for This Property
The Home Valuation Report is an in-depth analysis detailing your home's value as well as a comparison with similar homes in the area
Home Values in the Area
Average Home Value in this Area
Purchase History
| Date | Buyer | Sale Price | Title Company |
|---|---|---|---|
| Wallman Joint Revocable Living Trust | -- | None Listed On Document | |
| Pund Douglas A | $428,000 | Attorney | |
| Millennium Fine Homes Llc | $76,500 | -- | |
| Pund Douglas | -- | -- |
Source: Public Records
Mortgage History
| Date | Status | Borrower | Loan Amount |
|---|---|---|---|
| Previous Owner | Pund Douglas A | $342,400 | |
| Previous Owner | Pund Douglas | $382,914 |
Source: Public Records
Tax History Compared to Growth
Tax History
| Year | Tax Paid | Tax Assessment Tax Assessment Total Assessment is a certain percentage of the fair market value that is determined by local assessors to be the total taxable value of land and additions on the property. | Land | Improvement |
|---|---|---|---|---|
| 2024 | $7,260 | $129,080 | $28,110 | $100,970 |
| 2023 | $7,260 | $129,080 | $28,110 | $100,970 |
| 2022 | $7,330 | $114,230 | $28,110 | $86,120 |
| 2021 | $7,403 | $114,230 | $28,110 | $86,120 |
| 2020 | $7,438 | $114,230 | $28,110 | $86,120 |
| 2019 | $7,566 | $106,690 | $23,960 | $82,730 |
| 2018 | $6,594 | $106,690 | $23,960 | $82,730 |
| 2017 | $6,442 | $106,690 | $23,960 | $82,730 |
| 2016 | $6,353 | $101,430 | $23,960 | $77,470 |
| 2015 | $6,393 | $101,430 | $23,960 | $77,470 |
| 2014 | $6,243 | $101,430 | $23,960 | $77,470 |
Source: Public Records
Map
Nearby Homes
- 295 Stratford Ln
- 463 Valhalla Ct
- 185 Barrington Village Dr
- 90 Pawleys Plantation Ct
- 2284 Annandale Place
- 705 Memorial Dr
- 29 Governors Club Dr
- 2176 Meridian Ct
- 33 Governors Club Dr
- 131 Ridgebrook Trail
- 153 George Wythe Way
- 2580 Paydon Randoff Rd
- 3109 Indian Ripple Rd
- 179 Honey Jane Dr
- 264 S Alpha Bellbrook Rd
- 79.4 acres Valley Springs Rd
- 3211 Tarleton Dr
- 331 N Valley Rd
- Cheswicke Plan at Sky Crossing
- Barrett Plan at Sky Crossing
- Lot 195 Sherbourne Way
- 193 Sherbourne Way
- 2489 Sherbourne Way
- 0 Essex Ct Unit Lot 225 737483
- 2481 Sherbourne Way
- 2497 Sherbourne Way
- 2472 Sherbourne Way
- 2475 Sherbourne Way
- 331 Essex Ct
- 0 Sherbourne Way Unit Lot 193 737481
- 0 Sherbourne Way Unit 214
- 0 Sherbourne Way Unit 217
- 2503 Sherbourne Way
- 327 Essex Ct
- 319 Essex Ct
- 2498 Bexley Hill Place
- 2504 Bexley Hill Place
- 2514 Bexley Hill Place
- 2509 Sherbourne Way
- 2488 Bexley Hill Place