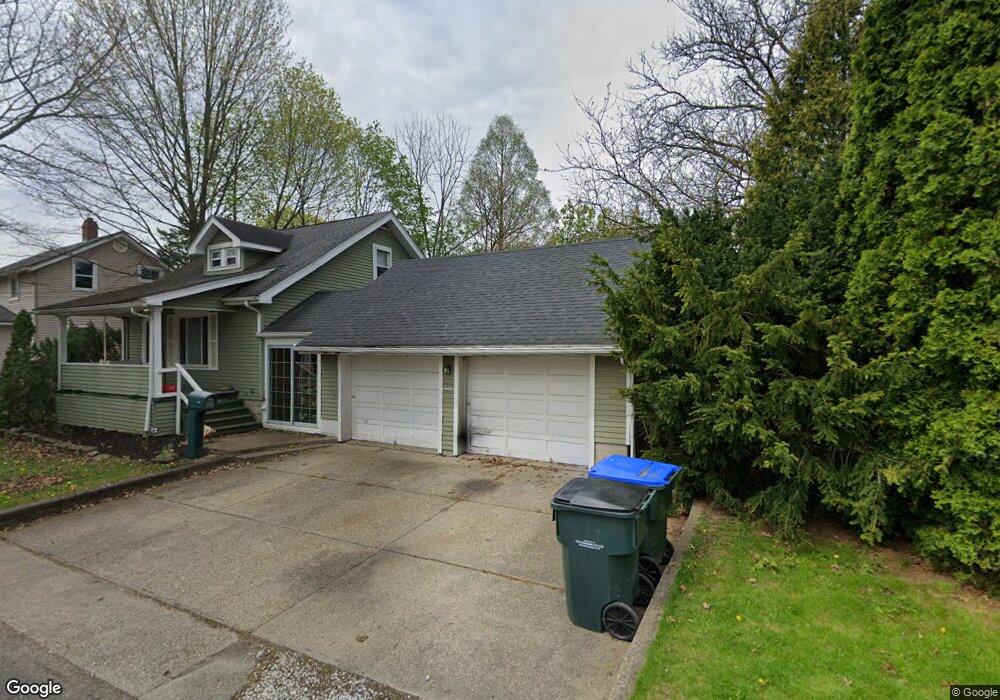
2488 9th Ct Cuyahoga Falls, OH 44221
Mud Brook NeighborhoodEstimated Value: $139,000 - $159,204
1
Bed
1
Bath
702
Sq Ft
$209/Sq Ft
Est. Value
About This Home
This home is located at 2488 9th Ct, Cuyahoga Falls, OH 44221 and is currently estimated at $146,551, approximately $208 per square foot. 2488 9th Ct is a home located in Summit County with nearby schools including Dewitt Elementary School, Bolich Middle School, and Cuyahoga Falls High School.
Ownership History
Date
Name
Owned For
Owner Type
Purchase Details
Closed on
Nov 20, 2020
Sold by
Casto James L
Bought by
2488 9Th Ct Ltd
Current Estimated Value
Purchase Details
Closed on
Oct 22, 2018
Sold by
2304 Chestnut Ltd
Bought by
Casto James L
Purchase Details
Closed on
Sep 1, 2009
Sold by
Casto James L
Bought by
2304 Chestnut Ltd
Purchase Details
Closed on
Oct 10, 2003
Sold by
Henricks Carl
Bought by
Casto James L
Create a Home Valuation Report for This Property
The Home Valuation Report is an in-depth analysis detailing your home's value as well as a comparison with similar homes in the area
Home Values in the Area
Average Home Value in this Area
Purchase History
| Date | Buyer | Sale Price | Title Company |
|---|---|---|---|
| 2488 9Th Ct Ltd | -- | Buckeye Reserve Title Agency | |
| Casto James L | -- | Buckeyte Reserve Title Agenc | |
| 2304 Chestnut Ltd | -- | Attorney | |
| Casto James L | $57,300 | Buckeye Reserve Title Agency |
Source: Public Records
Tax History Compared to Growth
Tax History
| Year | Tax Paid | Tax Assessment Tax Assessment Total Assessment is a certain percentage of the fair market value that is determined by local assessors to be the total taxable value of land and additions on the property. | Land | Improvement |
|---|---|---|---|---|
| 2025 | $2,580 | $46,729 | $7,308 | $39,421 |
| 2024 | $2,580 | $46,729 | $7,308 | $39,421 |
| 2023 | $2,580 | $46,729 | $7,308 | $39,421 |
| 2022 | $2,370 | $34,875 | $5,457 | $29,418 |
| 2021 | $2,370 | $34,875 | $5,457 | $29,418 |
| 2020 | $2,332 | $34,880 | $5,460 | $29,420 |
| 2019 | $1,731 | $23,590 | $5,460 | $18,130 |
| 2018 | $1,476 | $23,590 | $5,460 | $18,130 |
| 2017 | $1,298 | $23,590 | $5,460 | $18,130 |
| 2016 | $1,299 | $20,980 | $5,460 | $15,520 |
| 2015 | $1,298 | $20,980 | $5,460 | $15,520 |
| 2014 | $1,298 | $20,980 | $5,460 | $15,520 |
| 2013 | $1,289 | $21,000 | $5,460 | $15,540 |
Source: Public Records
Map
Nearby Homes