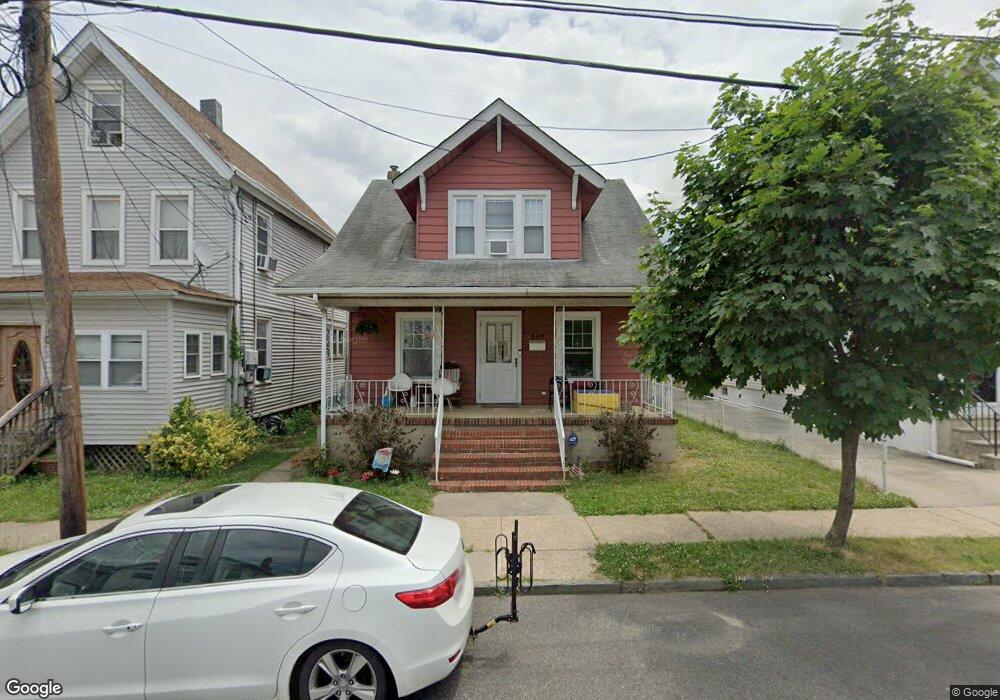
249 1st St South Amboy, NJ 08879
Estimated Value: $413,679 - $445,000
3
Beds
1
Bath
1,244
Sq Ft
$342/Sq Ft
Est. Value
About This Home
This home is located at 249 1st St, South Amboy, NJ 08879 and is currently estimated at $425,170, approximately $341 per square foot. 249 1st St is a home located in Middlesex County with nearby schools including South Amboy Elementary School, South Amboy Middle/High School, and St. Mary Elementary School.
Ownership History
Date
Name
Owned For
Owner Type
Purchase Details
Closed on
Oct 9, 2009
Sold by
Connors Debra A and Booker Ross Edward
Bought by
Brogan Ryan G
Current Estimated Value
Home Financials for this Owner
Home Financials are based on the most recent Mortgage that was taken out on this home.
Original Mortgage
$230,743
Outstanding Balance
$149,901
Interest Rate
4.98%
Mortgage Type
FHA
Estimated Equity
$275,269
Create a Home Valuation Report for This Property
The Home Valuation Report is an in-depth analysis detailing your home's value as well as a comparison with similar homes in the area
Home Values in the Area
Average Home Value in this Area
Purchase History
| Date | Buyer | Sale Price | Title Company |
|---|---|---|---|
| Brogan Ryan G | $235,000 | Fidelity Natl Title Ins Co |
Source: Public Records
Mortgage History
| Date | Status | Borrower | Loan Amount |
|---|---|---|---|
| Open | Brogan Ryan G | $230,743 |
Source: Public Records
Tax History Compared to Growth
Tax History
| Year | Tax Paid | Tax Assessment Tax Assessment Total Assessment is a certain percentage of the fair market value that is determined by local assessors to be the total taxable value of land and additions on the property. | Land | Improvement |
|---|---|---|---|---|
| 2025 | $6,810 | $212,200 | $118,700 | $93,500 |
| 2024 | $6,553 | $212,200 | $118,700 | $93,500 |
| 2023 | $6,553 | $212,200 | $118,700 | $93,500 |
| 2022 | $6,226 | $212,200 | $118,700 | $93,500 |
| 2021 | $6,122 | $212,200 | $118,700 | $93,500 |
| 2020 | $5,978 | $212,200 | $118,700 | $93,500 |
| 2019 | $5,882 | $212,200 | $118,700 | $93,500 |
| 2018 | $5,833 | $212,200 | $118,700 | $93,500 |
| 2017 | $5,740 | $212,200 | $118,700 | $93,500 |
| 2016 | $5,596 | $212,200 | $118,700 | $93,500 |
| 2015 | $5,636 | $212,200 | $118,700 | $93,500 |
| 2014 | $5,443 | $212,200 | $118,700 | $93,500 |
Source: Public Records
Map
Nearby Homes