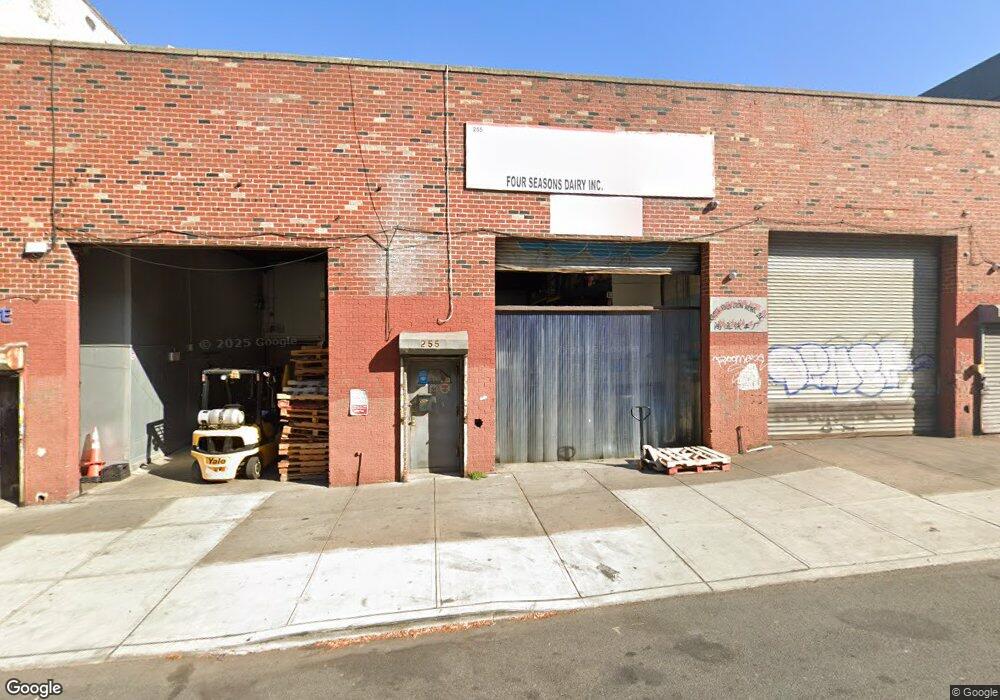
249-261 58th St Brooklyn, NY 11220
Sunset Park NeighborhoodEstimated Value: $3,447,095
Studio
--
Bath
12,360
Sq Ft
$279/Sq Ft
Est. Value
About This Home
This home is located at 249-261 58th St, Brooklyn, NY 11220 and is currently estimated at $3,447,095, approximately $278 per square foot. 249-261 58th St is a home located in Kings County with nearby schools including P.S. 503: The School of Discovery, IS 220 John J. Pershing, and Fort Hamilton High School.
Ownership History
Date
Name
Owned For
Owner Type
Purchase Details
Closed on
Dec 27, 2018
Sold by
249 58Th Street Corp
Bought by
249 58 Llc
Current Estimated Value
Home Financials for this Owner
Home Financials are based on the most recent Mortgage that was taken out on this home.
Original Mortgage
$2,600,000
Outstanding Balance
$2,258,926
Interest Rate
4.8%
Mortgage Type
Purchase Money Mortgage
Estimated Equity
$1,188,169
Purchase Details
Closed on
Aug 23, 2018
Sold by
Moish Gas Stations Inc
Bought by
249 58Th Street Corp
Purchase Details
Closed on
Sep 12, 2012
Sold by
Devito Jason
Bought by
Biss Group Ltd
Purchase Details
Closed on
Aug 10, 2010
Sold by
3E Inc
Bought by
Devito Jason
Purchase Details
Closed on
Dec 1, 2008
Sold by
265 58Th Streat Realty Corp
Bought by
3 E Inc
Purchase Details
Closed on
Aug 26, 1999
Sold by
Moish Gas Stations Inc
Bought by
265-58Th Street Realty Corp
Create a Home Valuation Report for This Property
The Home Valuation Report is an in-depth analysis detailing your home's value as well as a comparison with similar homes in the area
Home Values in the Area
Average Home Value in this Area
Purchase History
We collect this data history from publicly available records. To have your information removed, we recommend requesting removal directly through your county’s website.
| Date | Buyer | Sale Price | Title Company |
|---|---|---|---|
| 249 58 Llc | $3,000,000 | -- | |
| 249 58Th Street Corp | -- | -- | |
| Biss Group Ltd | -- | -- | |
| Devito Jason | -- | -- | |
| 3 E Inc | -- | -- | |
| 265-58Th Street Realty Corp | -- | First American Title Ins Co |
Source: Public Records
Mortgage History
We collect this data history from publicly available records. To have your information removed, we recommend requesting removal directly through your county’s website.
| Date | Status | Borrower | Loan Amount |
|---|---|---|---|
| Open | 249 58 Llc | $2,600,000 |
Source: Public Records
Tax History
| Year | Tax Paid | Tax Assessment Tax Assessment Total Assessment is a certain percentage of the fair market value that is determined by local assessors to be the total taxable value of land and additions on the property. | Land | Improvement |
|---|---|---|---|---|
| 2026 | $45,271 | $442,350 | $189,450 | $252,900 |
| 2025 | $43,660 | $440,100 | $189,450 | $250,650 |
| 2024 | $43,660 | $441,000 | $189,450 | $251,550 |
| 2023 | $43,289 | $475,650 | $189,450 | $286,200 |
| 2022 | $41,612 | $434,700 | $189,450 | $245,250 |
| 2021 | $33,349 | $311,850 | $189,450 | $122,400 |
| 2020 | $20,445 | $397,800 | $189,450 | $208,350 |
| 2019 | $38,579 | $413,100 | $189,450 | $223,650 |
| 2018 | $36,516 | $377,100 | $189,450 | $187,650 |
| 2017 | $34,397 | $327,150 | $189,450 | $137,700 |
| 2016 | $33,727 | $369,000 | $189,450 | $179,550 |
| 2015 | $13,976 | $348,300 | $189,450 | $158,850 |
| 2014 | $13,976 | $315,000 | $189,450 | $125,550 |
Source: Public Records
Map
Nearby Homes
Your Personal Tour Guide
Ask me questions while you tour the home.