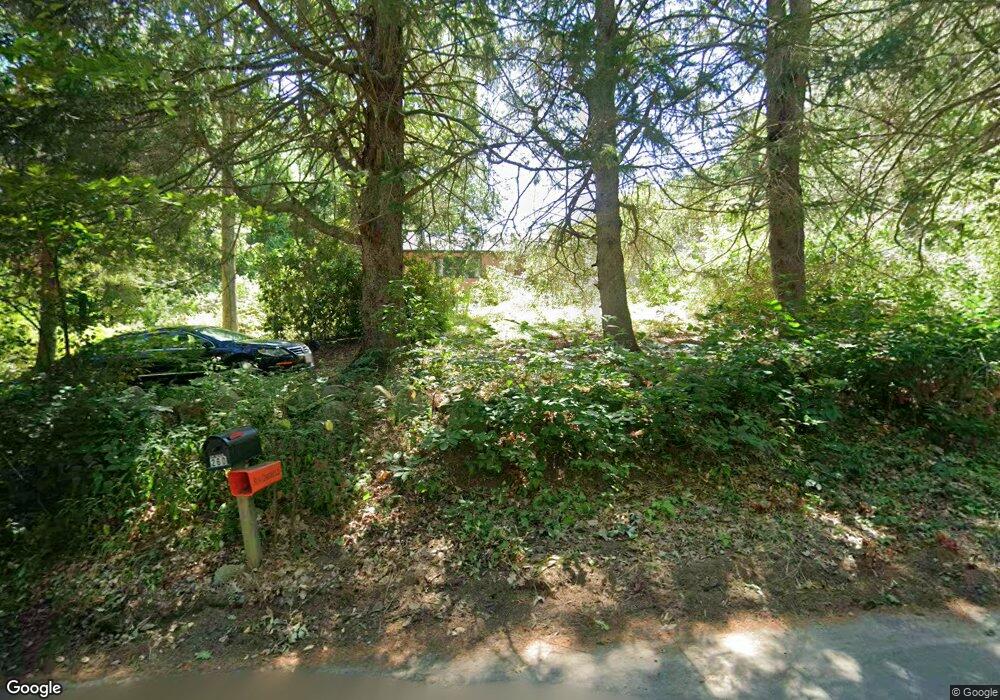
249 Bennett St Wrentham, MA 02093
Estimated Value: $741,000 - $1,185,000
6
Beds
2
Baths
3,949
Sq Ft
$231/Sq Ft
Est. Value
About This Home
This home is located at 249 Bennett St, Wrentham, MA 02093 and is currently estimated at $911,698, approximately $230 per square foot. 249 Bennett St is a home located in Norfolk County with nearby schools including Delaney Elementary School and Charles E Roderick.
Ownership History
Date
Name
Owned For
Owner Type
Purchase Details
Closed on
Jan 31, 2022
Sold by
Knight Charles R
Bought by
Knight Christopher R and Knight Candice S
Current Estimated Value
Home Financials for this Owner
Home Financials are based on the most recent Mortgage that was taken out on this home.
Original Mortgage
$264,957
Outstanding Balance
$244,048
Interest Rate
3.22%
Mortgage Type
Purchase Money Mortgage
Estimated Equity
$667,650
Create a Home Valuation Report for This Property
The Home Valuation Report is an in-depth analysis detailing your home's value as well as a comparison with similar homes in the area
Home Values in the Area
Average Home Value in this Area
Purchase History
| Date | Buyer | Sale Price | Title Company |
|---|---|---|---|
| Knight Christopher R | $259,000 | None Available |
Source: Public Records
Mortgage History
| Date | Status | Borrower | Loan Amount |
|---|---|---|---|
| Open | Knight Christopher R | $264,957 |
Source: Public Records
Tax History Compared to Growth
Tax History
| Year | Tax Paid | Tax Assessment Tax Assessment Total Assessment is a certain percentage of the fair market value that is determined by local assessors to be the total taxable value of land and additions on the property. | Land | Improvement |
|---|---|---|---|---|
| 2025 | $7,999 | $690,200 | $323,300 | $366,900 |
| 2024 | $6,466 | $538,800 | $323,300 | $215,500 |
| 2023 | $6,249 | $495,200 | $295,700 | $199,500 |
| 2022 | $6,089 | $445,400 | $277,200 | $168,200 |
| 2021 | $5,691 | $404,500 | $244,600 | $159,900 |
| 2020 | $5,297 | $371,700 | $219,800 | $151,900 |
| 2019 | $5,213 | $369,200 | $219,800 | $149,400 |
| 2018 | $4,977 | $349,500 | $218,400 | $131,100 |
| 2017 | $4,730 | $331,900 | $214,200 | $117,700 |
| 2016 | $4,617 | $323,300 | $207,900 | $115,400 |
| 2015 | $4,452 | $297,200 | $200,000 | $97,200 |
| 2014 | $4,380 | $286,100 | $192,400 | $93,700 |
Source: Public Records
Map
Nearby Homes
- 791 South St Unit 5
- 440 Chestnut St
- 50 Green St
- 80 Carriage House Ln
- Lot 1 - Blueberry 2 Car Plan at King Philip Estates
- Lot 8 - Blueberry 2 Car Plan at King Philip Estates
- Lot 5 - Hughes 2 car Plan at King Philip Estates
- Lot 6 - Blueberry 3 Car Plan at King Philip Estates
- Lot 2 - Camden 2 Car Plan at King Philip Estates
- Lot 7 - Cedar Plan at King Philip Estates
- Lot 4 - Hemingway 2 Car Plan at King Philip Estates
- Lot 3 - Blueberry 2 Car Plan at King Philip Estates
- Lot 3 - 14 Earle Stewart Ln
- 11 Earle Stewart Ln
- 131 Creek St Unit 7
- 1204 South St
- 1222 South St
- 955 Summer St
- 570 Franklin St
- 319 Taunton St