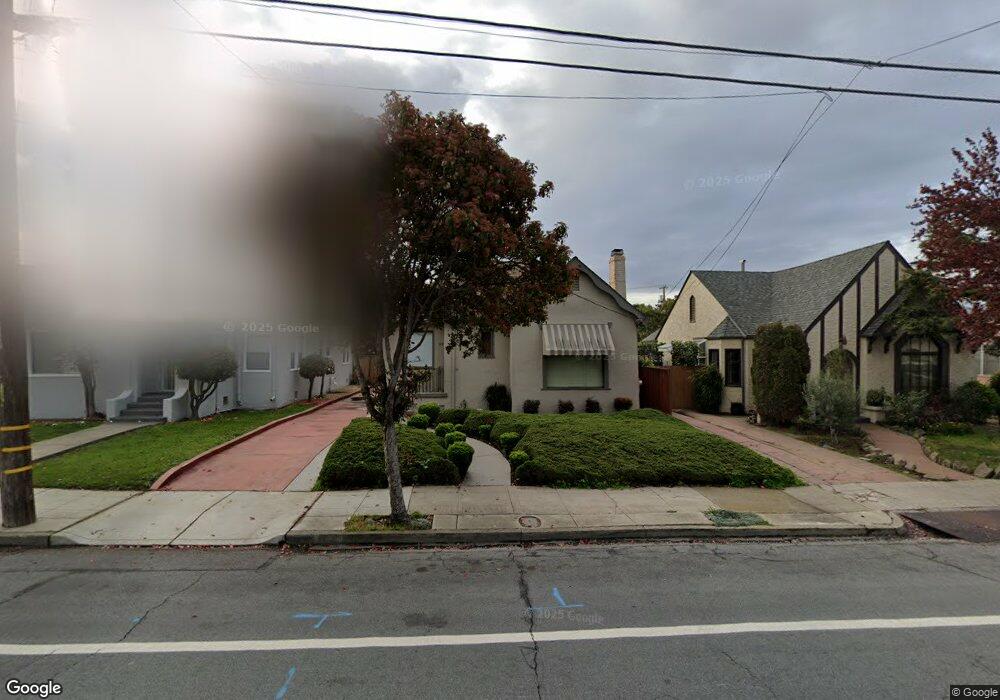
249 Best Ave San Leandro, CA 94577
Farrelly Pond District NeighborhoodEstimated Value: $693,000 - $797,000
About This Home
This home is located at 249 Best Ave, San Leandro, CA 94577 and is currently estimated at $755,471, approximately $642 per square foot. 249 Best Ave is a home located in Alameda County with nearby schools including Washington Elementary School, Bancroft Middle School, and San Leandro High School.
Ownership History
We collect this data history from publicly available records. To have your information removed, we recommend requesting removal directly through your county’s website.
Purchase Details
Purchase Details
Home Financials for this Owner
Home Financials are based on the most recent Mortgage that was taken out on this home.Home Values in the Area
Average Home Value in this Area
Purchase History
We collect this data history from publicly available records. To have your information removed, we recommend requesting removal directly through your county’s website.
| Date | Buyer | Sale Price | Title Company |
|---|---|---|---|
| -- | None Available | ||
| $156,500 | First American Title Guarant |
Mortgage History
We collect this data history from publicly available records. To have your information removed, we recommend requesting removal directly through your county’s website.
| Date | Status | Borrower | Loan Amount |
|---|---|---|---|
| Previous Owner | $148,650 |
Tax History
We collect this data history from publicly available records. To have your information removed, we recommend requesting removal directly through your county’s website.
| Year | Tax Paid | Tax Assessment Tax Assessment Total Assessment is a certain percentage of the fair market value that is determined by local assessors to be the total taxable value of land and additions on the property. | Land | Improvement |
|---|---|---|---|---|
| 2025 | $3,981 | $255,858 | $78,941 | $183,917 |
| 2024 | $3,981 | $250,704 | $77,393 | $180,311 |
| 2023 | $3,915 | $252,652 | $75,876 | $176,776 |
| 2022 | $3,805 | $240,700 | $74,389 | $173,311 |
| 2021 | $3,660 | $235,843 | $72,930 | $169,913 |
| 2020 | $3,541 | $240,354 | $72,183 | $168,171 |
| 2019 | $3,442 | $235,641 | $70,767 | $164,874 |
| 2018 | $3,333 | $231,021 | $69,380 | $161,641 |
| 2017 | $3,291 | $226,492 | $68,020 | $158,472 |
| 2016 | $3,127 | $222,052 | $66,686 | $155,366 |
| 2015 | $3,071 | $218,717 | $65,685 | $153,032 |
| 2014 | $3,041 | $214,433 | $64,398 | $150,035 |
Map
- 291 Lorraine Blvd
- 98 Dutton Ave
- 708 Raineer Ct
- 224 Arroyo Ave
- 236 Haas Ave
- 400 Davis St Unit 301
- 145 Chumalia St
- 259 W Broadmoor Blvd
- 995 Karol Way
- 200 W Broadmoor Blvd
- 225 Chumalia St
- 243 Chumalia St
- 308 W Joaquin Ave
- 428 W Broadmoor Blvd
- 378 Alvarado St
- 381 Lexington Ave
- 11070 San Leandro St
- 957 Lee Ave
- 209 Dabner St
- 1147 Huff Ave
- 230 Peralta Ave
- 238 Peralta Ave
- 222 Peralta Ave
- 244 Peralta Ave
- 214 Peralta Ave
- 229 Best Ave
- 237 Best Ave
- 221 Best Ave
- 250 Peralta Ave
- 206 Peralta Ave
- 243 Best Ave
- 213 Best Ave
- 227 Peralta Ave
- 221 Peralta Ave
- 256 Peralta Ave
- 239 Peralta Ave
- 205 Best Ave
- 215 Peralta Ave
- 245 Peralta Ave
- 209 Peralta Ave
Ask me questions while you tour the home.