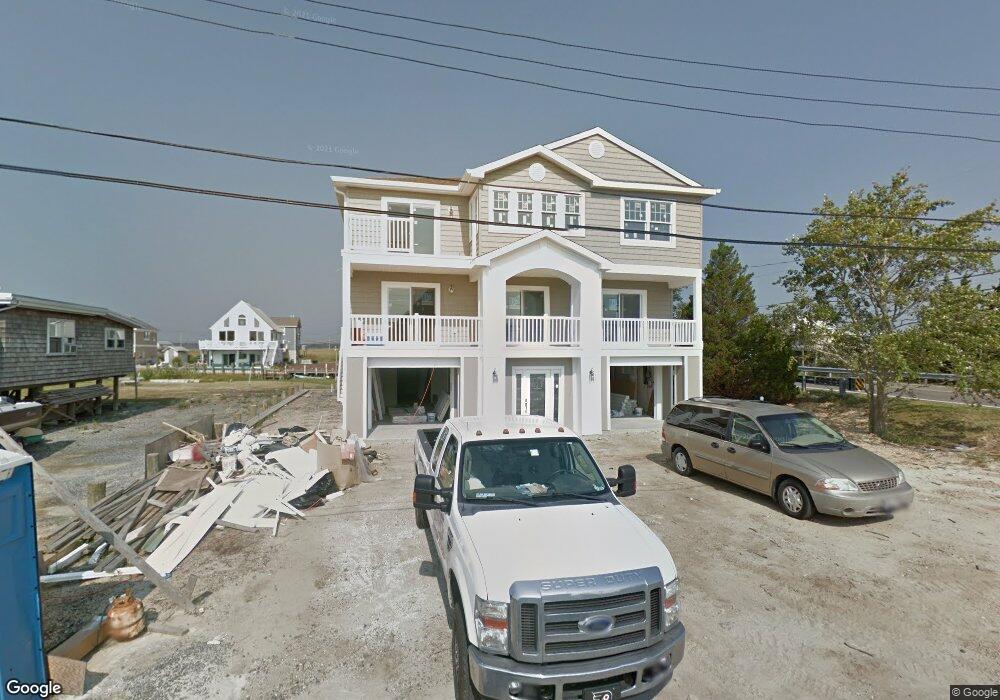
249 Black Duck Dr West Creek, NJ 08092
Eaglewood NeighborhoodEstimated Value: $820,978 - $1,067,000
5
Beds
5
Baths
3,620
Sq Ft
$253/Sq Ft
Est. Value
About This Home
This home is located at 249 Black Duck Dr, West Creek, NJ 08092 and is currently estimated at $915,245, approximately $252 per square foot. 249 Black Duck Dr is a home located in Ocean County with nearby schools including Eagleswood Elementary School, Pinelands Regional Junior High School, and Pinelands Regional High School.
Ownership History
Date
Name
Owned For
Owner Type
Purchase Details
Closed on
Dec 26, 2012
Sold by
Sorg Carl
Bought by
Sorg Carl and Dalme Linda
Current Estimated Value
Home Financials for this Owner
Home Financials are based on the most recent Mortgage that was taken out on this home.
Original Mortgage
$303,360
Interest Rate
3.35%
Mortgage Type
Construction
Purchase Details
Closed on
Dec 2, 2010
Sold by
Sorg Cynthia
Bought by
Sorg Carl
Create a Home Valuation Report for This Property
The Home Valuation Report is an in-depth analysis detailing your home's value as well as a comparison with similar homes in the area
Home Values in the Area
Average Home Value in this Area
Purchase History
| Date | Buyer | Sale Price | Title Company |
|---|---|---|---|
| Sorg Carl | -- | None Available | |
| Sorg Carl | -- | None Available |
Source: Public Records
Mortgage History
| Date | Status | Borrower | Loan Amount |
|---|---|---|---|
| Closed | Sorg Carl | $303,360 |
Source: Public Records
Tax History Compared to Growth
Tax History
| Year | Tax Paid | Tax Assessment Tax Assessment Total Assessment is a certain percentage of the fair market value that is determined by local assessors to be the total taxable value of land and additions on the property. | Land | Improvement |
|---|---|---|---|---|
| 2025 | $13,817 | $501,900 | $100,800 | $401,100 |
| 2024 | $13,762 | $501,900 | $100,800 | $401,100 |
| 2023 | $13,416 | $501,900 | $100,800 | $401,100 |
| 2022 | $13,416 | $501,900 | $100,800 | $401,100 |
| 2021 | $13,346 | $501,900 | $100,800 | $401,100 |
| 2020 | $13,612 | $501,900 | $100,800 | $401,100 |
| 2019 | $13,200 | $501,900 | $100,800 | $401,100 |
| 2018 | $12,312 | $501,900 | $100,800 | $401,100 |
| 2017 | $12,281 | $501,900 | $100,800 | $401,100 |
| 2016 | $11,875 | $501,900 | $100,800 | $401,100 |
| 2015 | $11,408 | $501,900 | $100,800 | $401,100 |
| 2014 | $11,032 | $134,400 | $134,400 | $0 |
Source: Public Records
Map
Nearby Homes