
Seller's Agent in 2025
Gary Mawson
Jersey Property Group Realty
(609) 839-8218
3 in this area
121 Total Sales
Estimated Value: $394,000 - $489,000
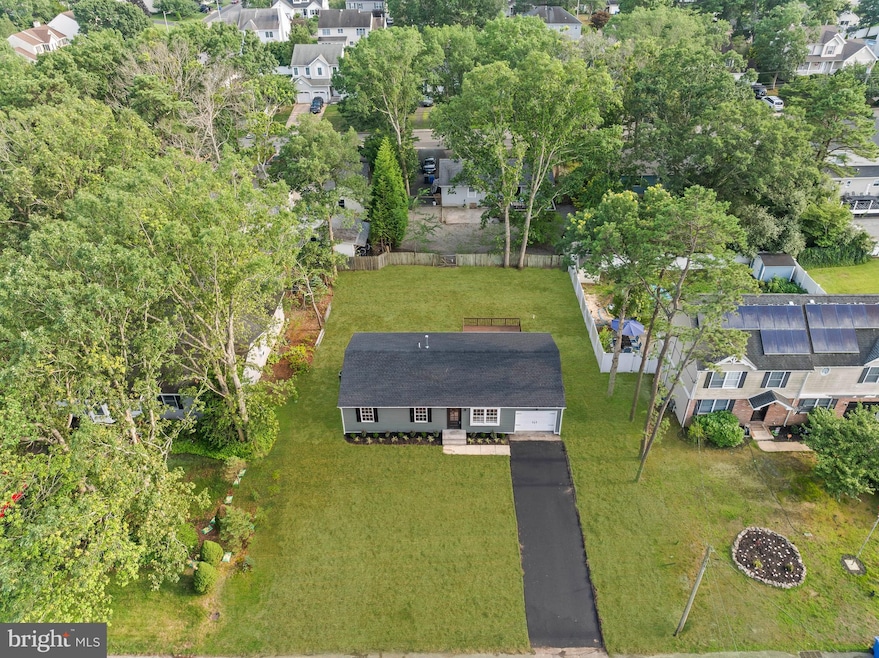
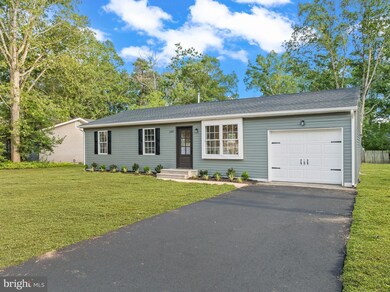
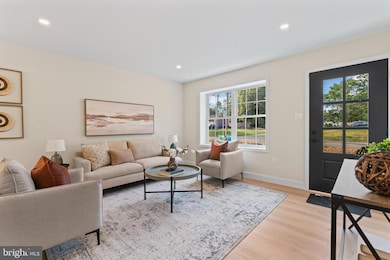
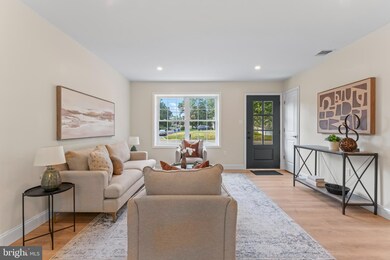
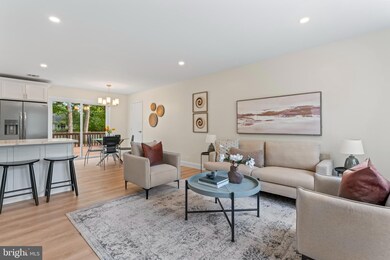
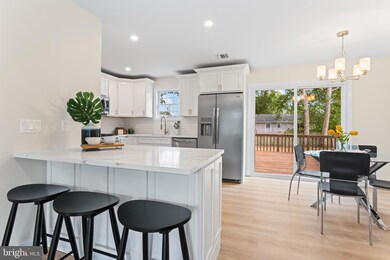
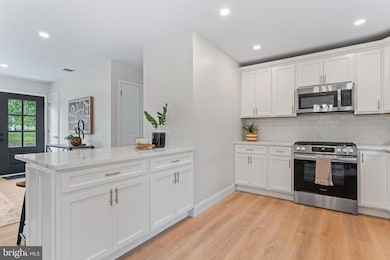
Welcome to your beautifully renovated home in the desirable Ocean Acres community of Manahawkin! This charming ranch-style residence has been thoughtfully updated from top to bottom, offering the perfect blend of style, comfort, and convenience. Step inside to an open and inviting floor plan featuring brand-new Luxury Vinyl Plank flooring throughout. The completely renovated kitchen is a true showstopper, boasting brand new appliances, sleek cabinetry, and modern finishes—ideal for everyday living and entertaining. Enjoy peace of mind with new roofing and siding, ensuring long-lasting quality and curb appeal. The home offers easy, single-level living. Situated just a short drive from the beaches of LBI, this home is perfect as a year-round residence or coastal retreat! Can Close Quickly!
Last Agent to Sell the Property
(732) 800-1767 sellyourhomenj@gmail.com Jersey Property Group Realty License #0792785 Listed on: 07/11/2025
We collect this data history from publicly available records. To have your information removed, we recommend requesting removal directly through your county’s website.
| Date | Buyer | Sale Price | Title Company |
|---|---|---|---|
| Bryson Jake | $435,000 | National Integrity | |
| Bryson Jake | $435,000 | National Integrity | |
| Prisco Acquistions Llc | $270,000 | Worldwide Title | |
| Prisco Acquistions Llc | $270,000 | Worldwide Title | |
| Velco Investments Llc | $240,000 | None Listed On Document | |
| Velco Investments Llc | $240,000 | None Listed On Document |
We collect this data history from publicly available records. To have your information removed, we recommend requesting removal directly through your county’s website.
| Date | Status | Borrower | Loan Amount |
|---|---|---|---|
| Open | Bryson Jake | $15,000 | |
| Closed | Bryson Jake | $15,000 | |
| Open | Bryson Jake | $413,250 | |
| Closed | Bryson Jake | $413,250 | |
| Previous Owner | Prisco Acquistions Llc | $318,750 |
| Date | Event | Price | List to Sale | Price per Sq Ft |
|---|---|---|---|---|
| 08/27/2025 08/27/25 | Sold | $435,000 | +2.4% | $440 / Sq Ft |
| 07/16/2025 07/16/25 | Pending | -- | -- | -- |
| 07/11/2025 07/11/25 | For Sale | $425,000 | -- | $430 / Sq Ft |
| Year | Tax Paid | Tax Assessment Tax Assessment Total Assessment is a certain percentage of the fair market value that is determined by local assessors to be the total taxable value of land and additions on the property. | Land | Improvement |
|---|---|---|---|---|
| 2025 | $3,950 | $150,600 | $61,600 | $89,000 |
| 2024 | $3,703 | $150,600 | $61,600 | $89,000 |
| 2023 | $3,545 | $150,600 | $61,600 | $89,000 |
| 2022 | $3,545 | $150,600 | $61,600 | $89,000 |
| 2021 | $3,497 | $150,600 | $61,600 | $89,000 |
| 2020 | $3,501 | $150,600 | $61,600 | $89,000 |
| 2019 | $3,452 | $150,600 | $61,600 | $89,000 |
| 2018 | $3,431 | $150,600 | $61,600 | $89,000 |
| 2017 | $3,360 | $142,800 | $61,600 | $81,200 |
| 2016 | $3,326 | $142,800 | $61,600 | $81,200 |
| 2015 | $3,209 | $142,800 | $61,600 | $81,200 |
| 2014 | $3,169 | $139,300 | $60,800 | $78,500 |
Seller's Agent in 2025
Gary Mawson
Jersey Property Group Realty
(609) 839-8218
3 in this area
121 Total Sales
D
Buyer's Agent in 2025
Dante Casella
EXP Realty, LLC
(866) 201-6210
1 in this area
184 Total Sales
Source: Bright MLS
MLS Number: NJOC2035398
APN: 31-00044-199-00013
Disclaimer: Certain information contained herein is derived from information provided by parties other than Homes.com. All information provided is deemed reliable, but is not guaranteed to be accurate and should be independently verified.
![]() The data relating to real estate for sale on this website appears in part through the BRIGHT Internet Data Exchange program, a voluntary cooperative exchange of property listing data between licensed real estate brokerage firms, and is provided by BRIGHT through a licensing agreement.
The data relating to real estate for sale on this website appears in part through the BRIGHT Internet Data Exchange program, a voluntary cooperative exchange of property listing data between licensed real estate brokerage firms, and is provided by BRIGHT through a licensing agreement.
Listing information is from various brokers who participate in the Bright MLS IDX program and not all listings may be visible on the site.
The property information being provided on or through the website is for the personal, non-commercial use of consumers and such information may not be used for any purpose other than to identify prospective properties consumers may be interested in purchasing.
Some properties which appear for sale on the website may no longer be available because they are for instance, under contract, sold or are no longer being offered for sale.
Property information displayed is deemed reliable but is not guaranteed.
Copyright 2026 Bright MLS, Inc.
Ask me questions while you tour the home.