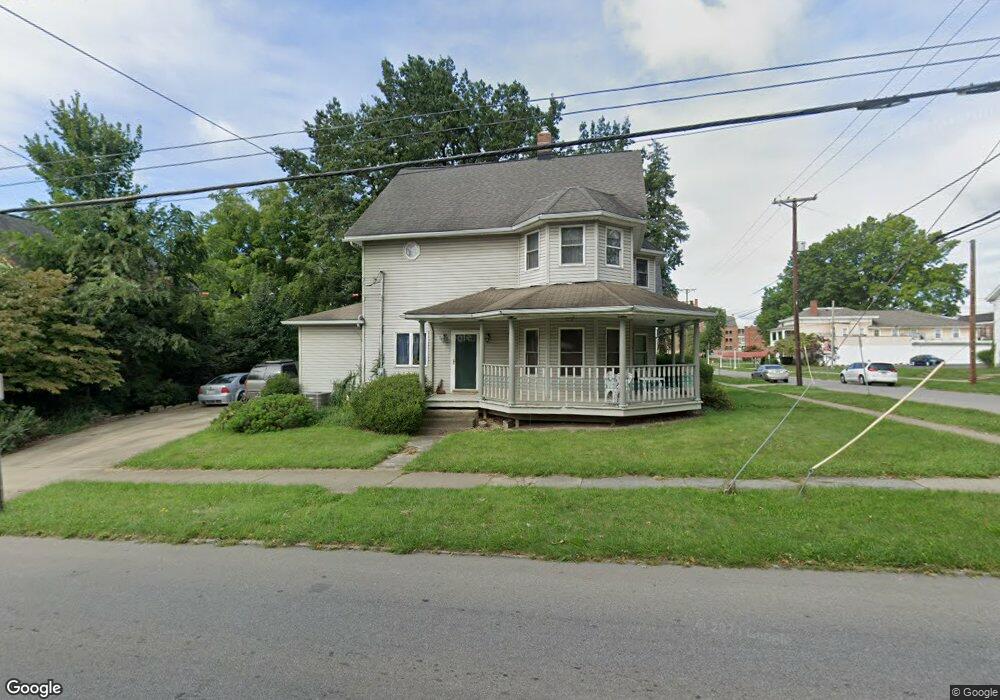
249 E Larwill St Wooster, OH 44691
Estimated Value: $173,000 - $188,000
3
Beds
2
Baths
2,002
Sq Ft
$90/Sq Ft
Est. Value
About This Home
This home is located at 249 E Larwill St, Wooster, OH 44691 and is currently estimated at $180,438, approximately $90 per square foot. 249 E Larwill St is a home located in Wayne County with nearby schools including Cornerstone Elementary School, Edgewood Middle School, and Wooster High School.
Ownership History
Date
Name
Owned For
Owner Type
Purchase Details
Closed on
May 9, 2024
Sold by
Bateman Elizabeth
Bought by
Bateman Charles
Current Estimated Value
Purchase Details
Closed on
Aug 5, 2005
Sold by
Miner Nason D and Miner Jessica
Bought by
Bateman Charles and Bateman Elizabeth
Home Financials for this Owner
Home Financials are based on the most recent Mortgage that was taken out on this home.
Original Mortgage
$104,362
Interest Rate
5.71%
Mortgage Type
FHA
Purchase Details
Closed on
Apr 16, 2001
Sold by
Carpenter David G
Bought by
Miner Nason D and Miner Jessica
Home Financials for this Owner
Home Financials are based on the most recent Mortgage that was taken out on this home.
Original Mortgage
$86,190
Interest Rate
7.05%
Mortgage Type
VA
Purchase Details
Closed on
Apr 24, 1992
Sold by
Woodward Hazel Valene
Bought by
Carpenter David G
Create a Home Valuation Report for This Property
The Home Valuation Report is an in-depth analysis detailing your home's value as well as a comparison with similar homes in the area
Home Values in the Area
Average Home Value in this Area
Purchase History
| Date | Buyer | Sale Price | Title Company |
|---|---|---|---|
| Bateman Charles | -- | None Listed On Document | |
| Bateman Charles | -- | None Listed On Document | |
| Bateman Charles | $106,000 | Fidelity Title | |
| Miner Nason D | $84,500 | -- | |
| Carpenter David G | $20,200 | -- |
Source: Public Records
Mortgage History
| Date | Status | Borrower | Loan Amount |
|---|---|---|---|
| Previous Owner | Bateman Charles | $104,362 | |
| Previous Owner | Miner Nason D | $86,190 |
Source: Public Records
Tax History
| Year | Tax Paid | Tax Assessment Tax Assessment Total Assessment is a certain percentage of the fair market value that is determined by local assessors to be the total taxable value of land and additions on the property. | Land | Improvement |
|---|---|---|---|---|
| 2024 | $1,726 | $41,760 | $7,700 | $34,060 |
| 2023 | $1,733 | $41,760 | $7,700 | $34,060 |
| 2022 | $1,545 | $29,610 | $5,460 | $24,150 |
| 2021 | $1,594 | $29,610 | $5,460 | $24,150 |
| 2020 | $1,511 | $29,610 | $5,460 | $24,150 |
| 2019 | $1,594 | $30,000 | $4,830 | $25,170 |
| 2018 | $1,599 | $30,000 | $4,830 | $25,170 |
| 2017 | $1,609 | $30,000 | $4,830 | $25,170 |
| 2016 | $1,660 | $28,840 | $4,640 | $24,200 |
| 2015 | $1,629 | $28,840 | $4,640 | $24,200 |
| 2014 | $1,630 | $28,840 | $4,640 | $24,200 |
| 2013 | $1,886 | $32,990 | $4,590 | $28,400 |
Source: Public Records
Map
Nearby Homes
- 223 E Larwill St
- 423 N Market St
- 419 Nold Ave
- 331 Derr Ave
- 227 N Walnut St
- 534 N Buckeye St
- 230 Clark Ave
- 134 E Bowman St Unit 1/2
- 606 E Henry St
- 814 N Bever St
- 140 Ohio St
- 5 E Melrose Unit 5
- 851 Park Blvd
- 1117 Quinby Ave
- 758 Western Dr
- 920 Washington St
- 938 Washington St
- 801 & 803 Colony Ct
- 1047 Ashwood Dr
- 1575 Bellevue Dr
- 243 E Larwill St
- 237 E Larwill St
- 234 N Bever St
- 228 N Bever St
- 231 Thomen Ct
- 238 E Larwill St
- 231 E Larwill St
- 241 N Bever St
- 250 E Larwill St
- 237 N Bever St
- 227 N Bever St
- 242 E Larwill St
- 214 N Bever St
- 226 Curry Ct
- 226 Curry Ct Unit 3
- 226 Curry Ct
- 226 Curry Ct Unit 4
- 226 Curry Ct Unit 2
- 318 N Bever St
- 310 E Larwill St
Your Personal Tour Guide
Ask me questions while you tour the home.