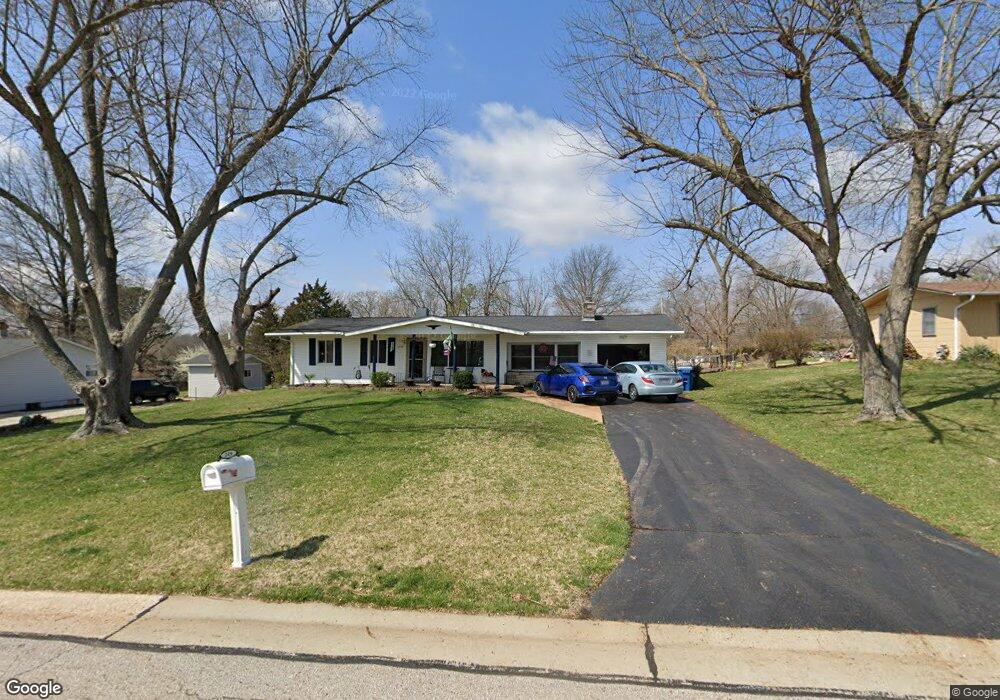
249 E Skyline Dr Ballwin, MO 63011
Estimated Value: $265,000 - $289,000
3
Beds
1
Bath
1,693
Sq Ft
$166/Sq Ft
Est. Value
About This Home
This home is located at 249 E Skyline Dr, Ballwin, MO 63011 and is currently estimated at $281,467, approximately $166 per square foot. 249 E Skyline Dr is a home located in St. Louis County with nearby schools including Westridge Elementary School, Crestview Middle School, and Marquette Sr. High School.
Ownership History
Date
Name
Owned For
Owner Type
Purchase Details
Closed on
Nov 3, 2010
Sold by
Stivan Investments Fund I Llc
Bought by
Major Cinthia
Current Estimated Value
Home Financials for this Owner
Home Financials are based on the most recent Mortgage that was taken out on this home.
Original Mortgage
$128,653
Outstanding Balance
$84,797
Interest Rate
4.25%
Mortgage Type
FHA
Estimated Equity
$196,670
Purchase Details
Closed on
Jun 18, 2010
Sold by
Eignteen Investments Inc
Bought by
Stivan Investments Fund I Llc
Home Financials for this Owner
Home Financials are based on the most recent Mortgage that was taken out on this home.
Original Mortgage
$586,089
Interest Rate
4.93%
Mortgage Type
Future Advance Clause Open End Mortgage
Purchase Details
Closed on
May 4, 2006
Sold by
Wilcox Nelda F
Bought by
Eighteen Investments Inc
Home Financials for this Owner
Home Financials are based on the most recent Mortgage that was taken out on this home.
Original Mortgage
$111,000
Interest Rate
6.36%
Mortgage Type
Purchase Money Mortgage
Purchase Details
Closed on
Nov 3, 1997
Sold by
Wilcox Doris L and Wilcox Nelda F
Bought by
Wilcox Nelda F and Jones Judy K
Create a Home Valuation Report for This Property
The Home Valuation Report is an in-depth analysis detailing your home's value as well as a comparison with similar homes in the area
Home Values in the Area
Average Home Value in this Area
Purchase History
| Date | Buyer | Sale Price | Title Company |
|---|---|---|---|
| Major Cinthia | $132,000 | None Available | |
| Stivan Investments Fund I Llc | $591,668 | None Available | |
| Eighteen Investments Inc | $111,000 | None Available | |
| Wilcox Nelda F | -- | None Available | |
| Wilcox Nelda F | -- | -- |
Source: Public Records
Mortgage History
| Date | Status | Borrower | Loan Amount |
|---|---|---|---|
| Open | Major Cinthia | $128,653 | |
| Previous Owner | Stivan Investments Fund I Llc | $586,089 | |
| Previous Owner | Eighteen Investments Inc | $111,000 |
Source: Public Records
Tax History
| Year | Tax Paid | Tax Assessment Tax Assessment Total Assessment is a certain percentage of the fair market value that is determined by local assessors to be the total taxable value of land and additions on the property. | Land | Improvement |
|---|---|---|---|---|
| 2025 | $2,874 | $44,330 | $29,930 | $14,400 |
| 2024 | $2,874 | $40,930 | $21,380 | $19,550 |
| 2023 | $2,872 | $40,930 | $21,380 | $19,550 |
| 2022 | $2,700 | $35,720 | $23,520 | $12,200 |
| 2021 | $2,680 | $35,720 | $23,520 | $12,200 |
| 2020 | $2,614 | $33,210 | $17,860 | $15,350 |
| 2019 | $2,625 | $33,210 | $17,860 | $15,350 |
| 2018 | $2,183 | $25,990 | $14,060 | $11,930 |
| 2017 | $2,132 | $25,990 | $14,060 | $11,930 |
| 2016 | $2,029 | $23,770 | $9,960 | $13,810 |
Source: Public Records
Map
Nearby Homes
- 239 E Skyline Dr
- 609 Log Hill Ct
- 53 Log Hill Ln
- 127 Ivy Ct
- 131 Romine Cir
- 807 Portsdown Rd Unit 33D
- 140 Burtonwood Dr
- 128 Shadalane Walk Unit A
- 815 Wendevy Ct Unit 16B
- 832 Wendevy Ct Unit 8B
- 222 Dale Ct
- 842 Wendevy Ct
- 835 Lilybud Ct Unit 5C
- 839 Lilybud Ct Unit 5A
- 313 Providence Rd
- 351 Greenbriar Ln
- 107 Falmouth Dr
- 623 Kenilworth Ln
- 557 Happy Ct
- 112 Shirley Ln
- 247 E Skyline Dr
- 251 E Skyline Dr
- 245 E Skyline Dr
- 253 E Skyline Dr
- 246 W Skyline Dr
- 248 W Skyline Dr
- 244 W Skyline Dr
- 252 E Skyline Dr
- 250 E Skyline Dr
- 254 E Skyline Dr
- 250 W Skyline Dr
- 242 W Skyline Dr
- 243 E Skyline Dr
- 255 E Skyline Dr
- 248 E Skyline Dr
- 256 E Skyline Dr
- 252 W Skyline Dr
- 240 W Skyline Dr
- 246 E Skyline Dr
- 258 E Skyline Dr
Your Personal Tour Guide
Ask me questions while you tour the home.